Using trajectory analysis to test and illustrate microsimulation outcomes
- Finnish Centre for Pensions, Finland
- University of Tampere, Finland
Cite this article
as: J. Salonen, H. Tikanmäki, T. Nummi; 2019; Using trajectory analysis to test and illustrate microsimulation outcomes; International Journal of Microsimulation; 12(2); 3-17.
doi: 10.34196/ijm.00198
Figures
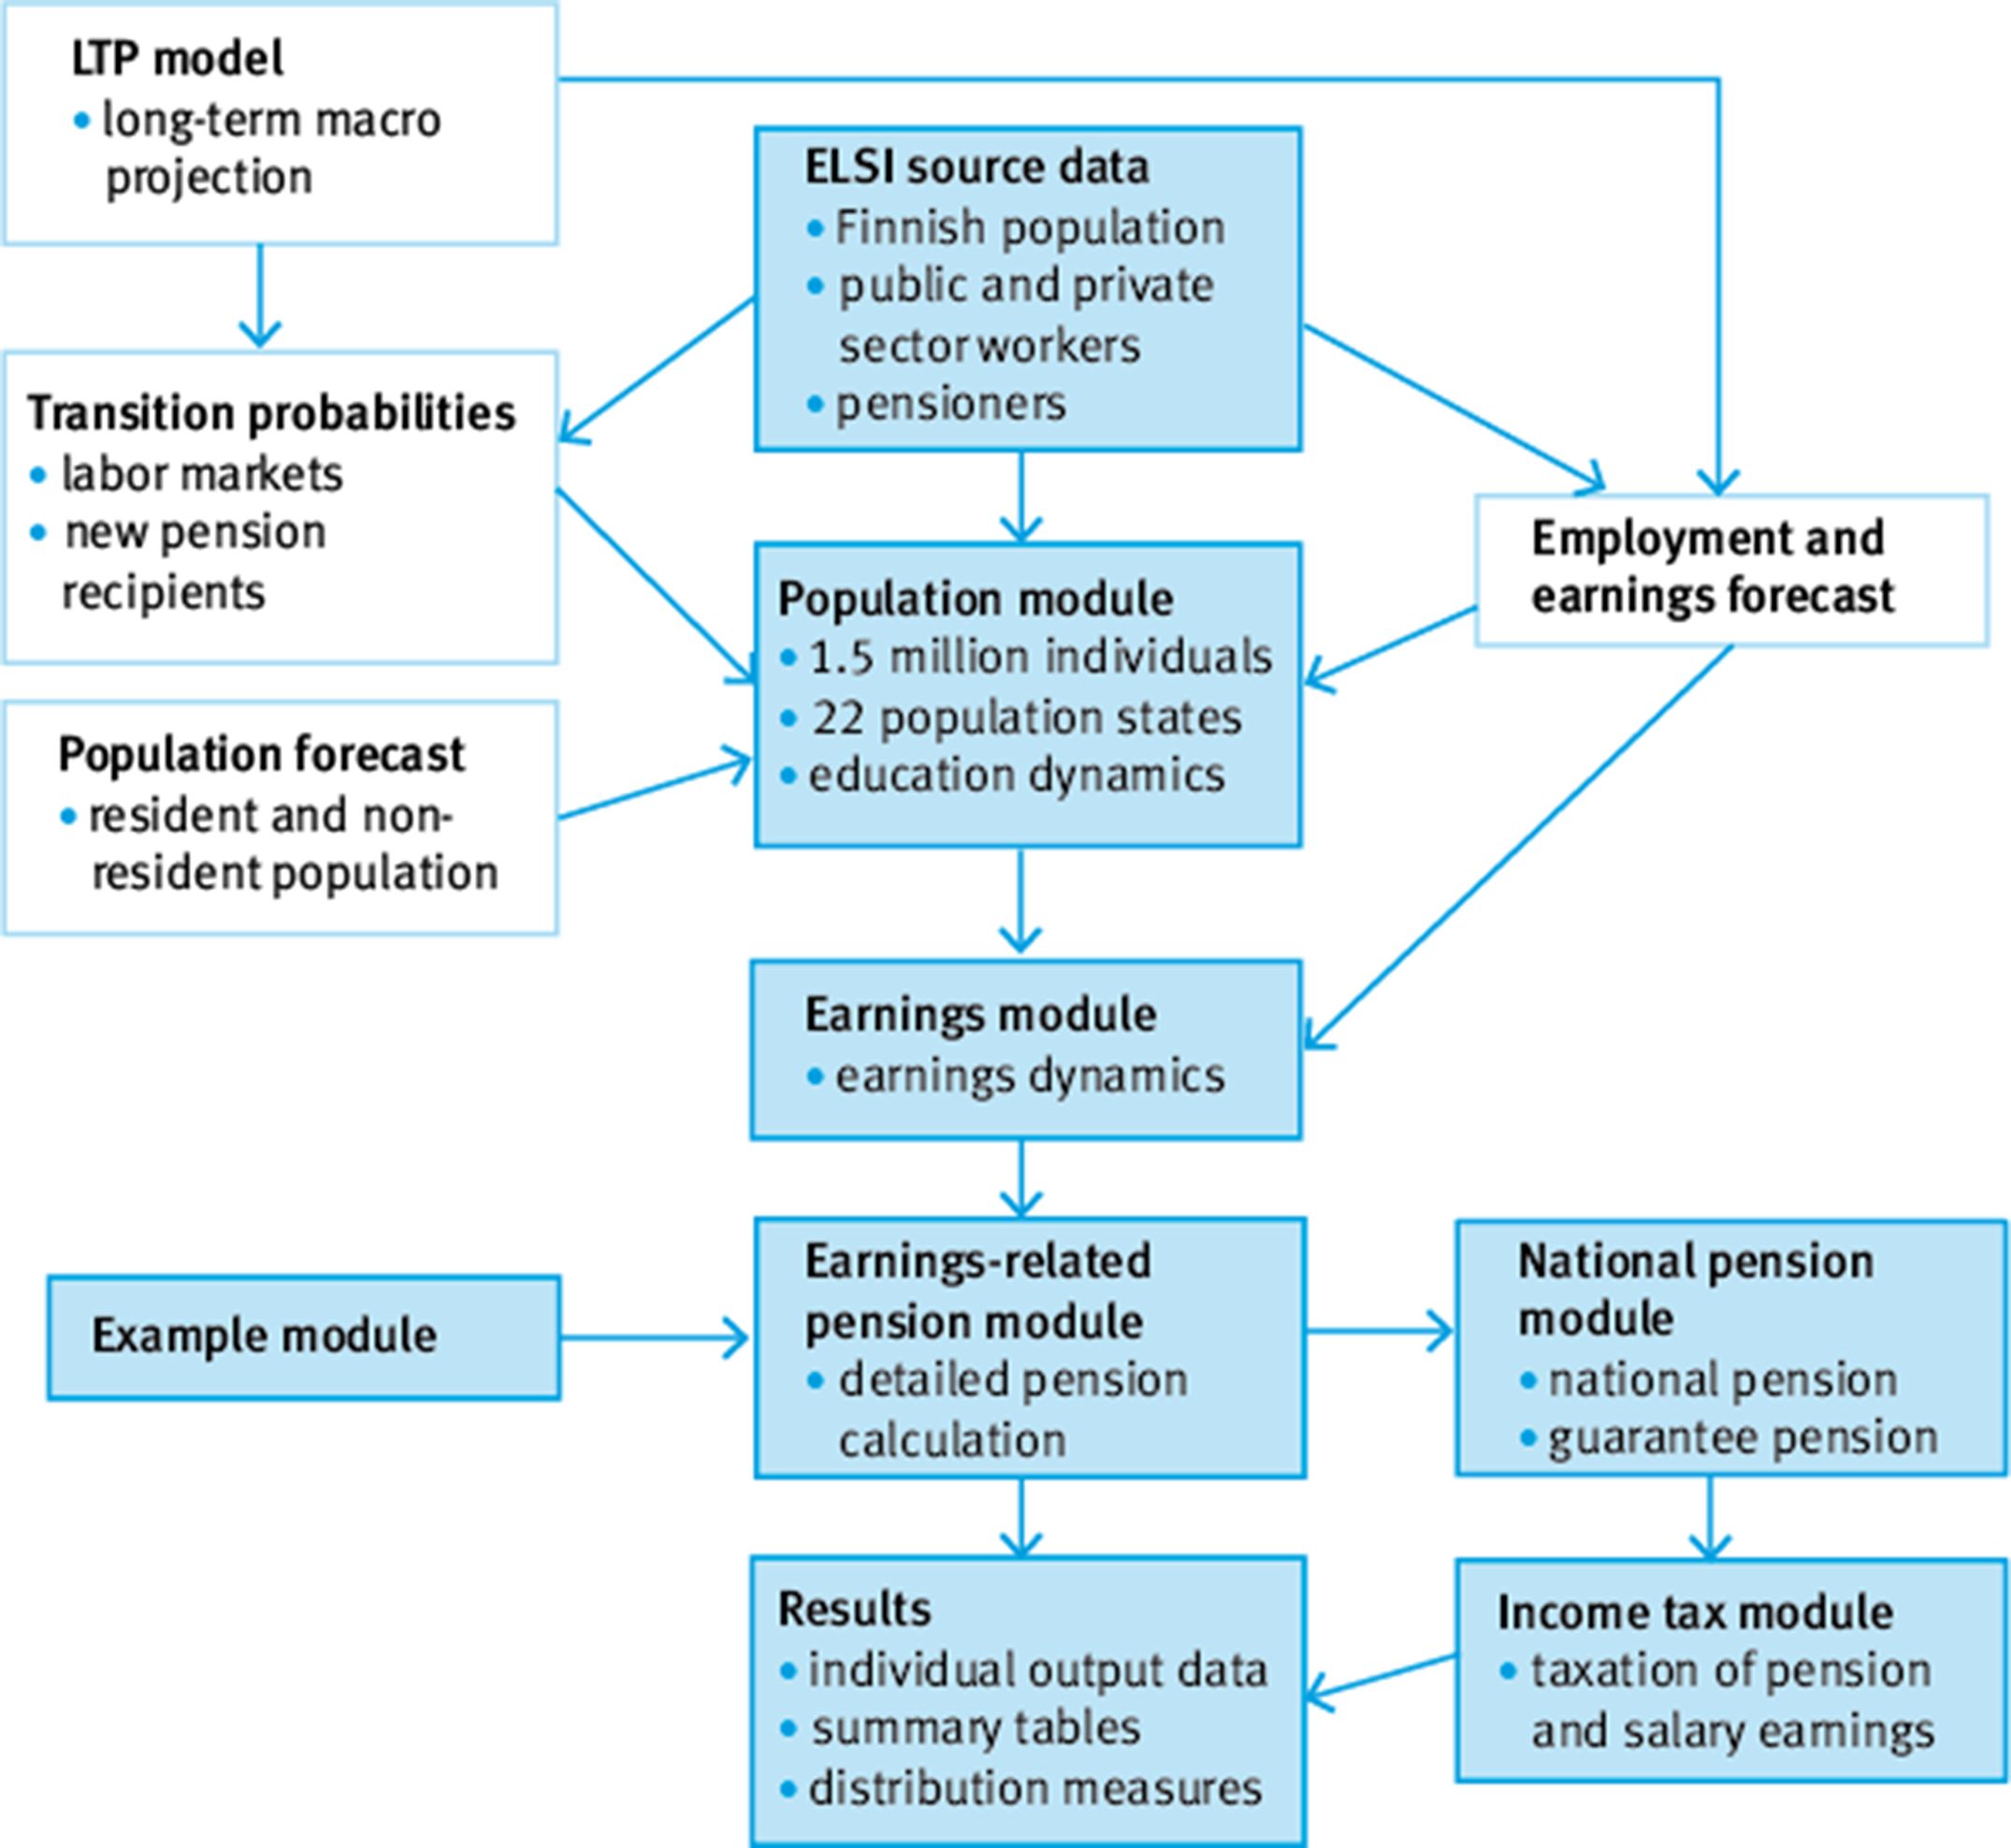
Figure 1

Structure of the ELSI microsimulation model
Figure 2

Earnings trajectories
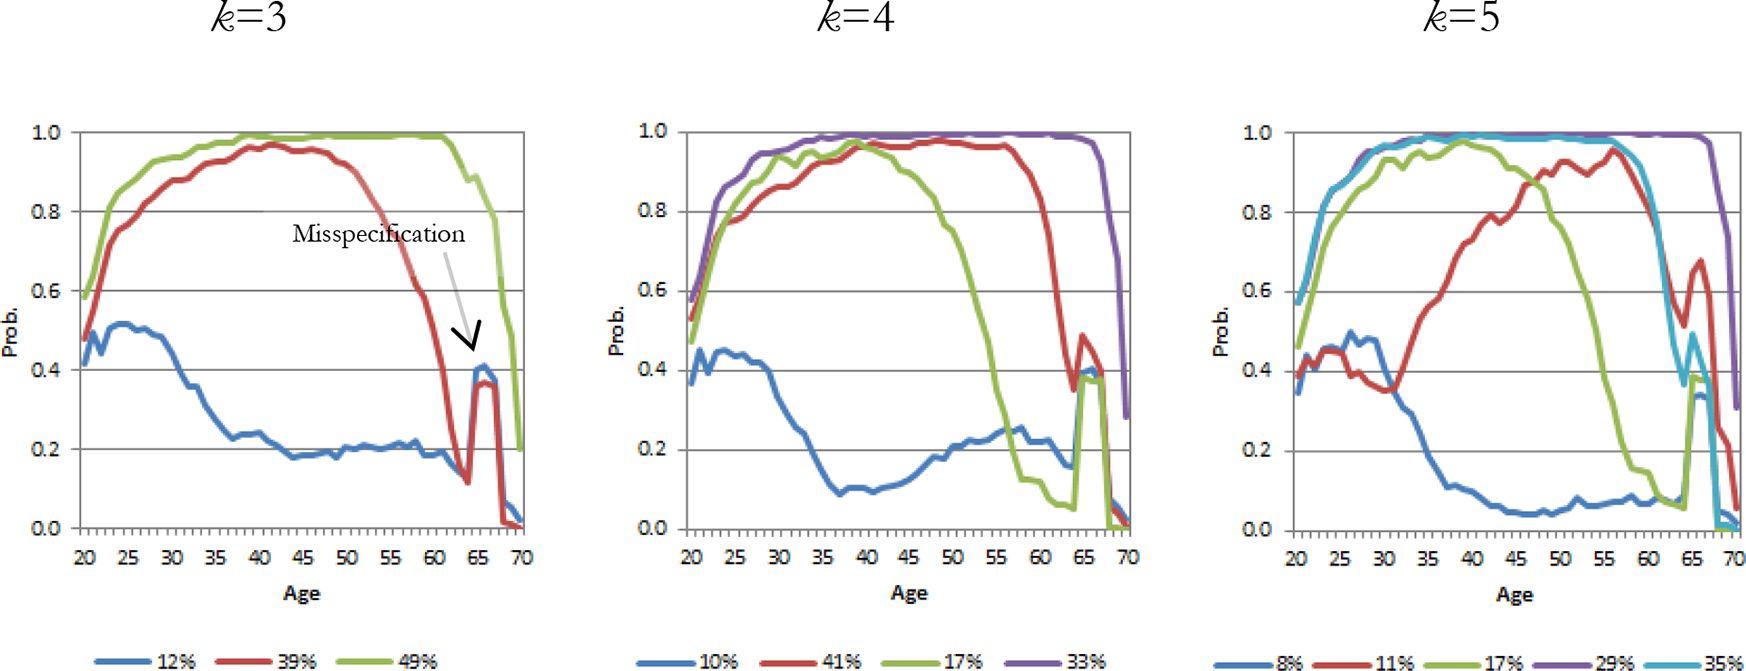
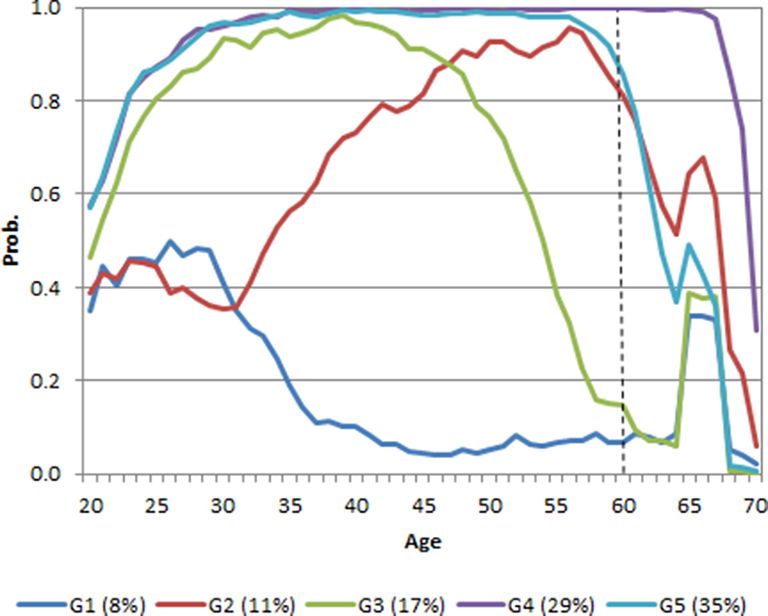
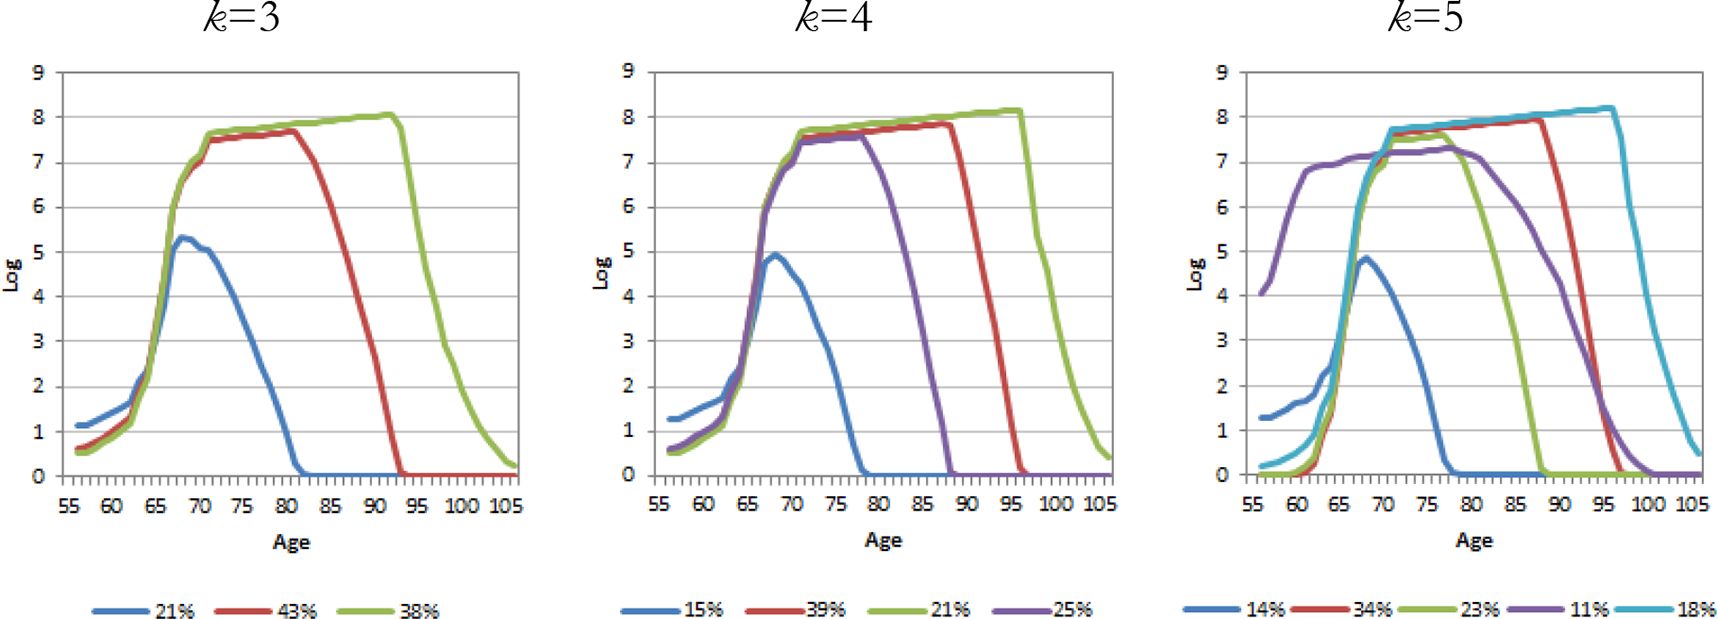
Figure 3

Earnings trajectories, k=5
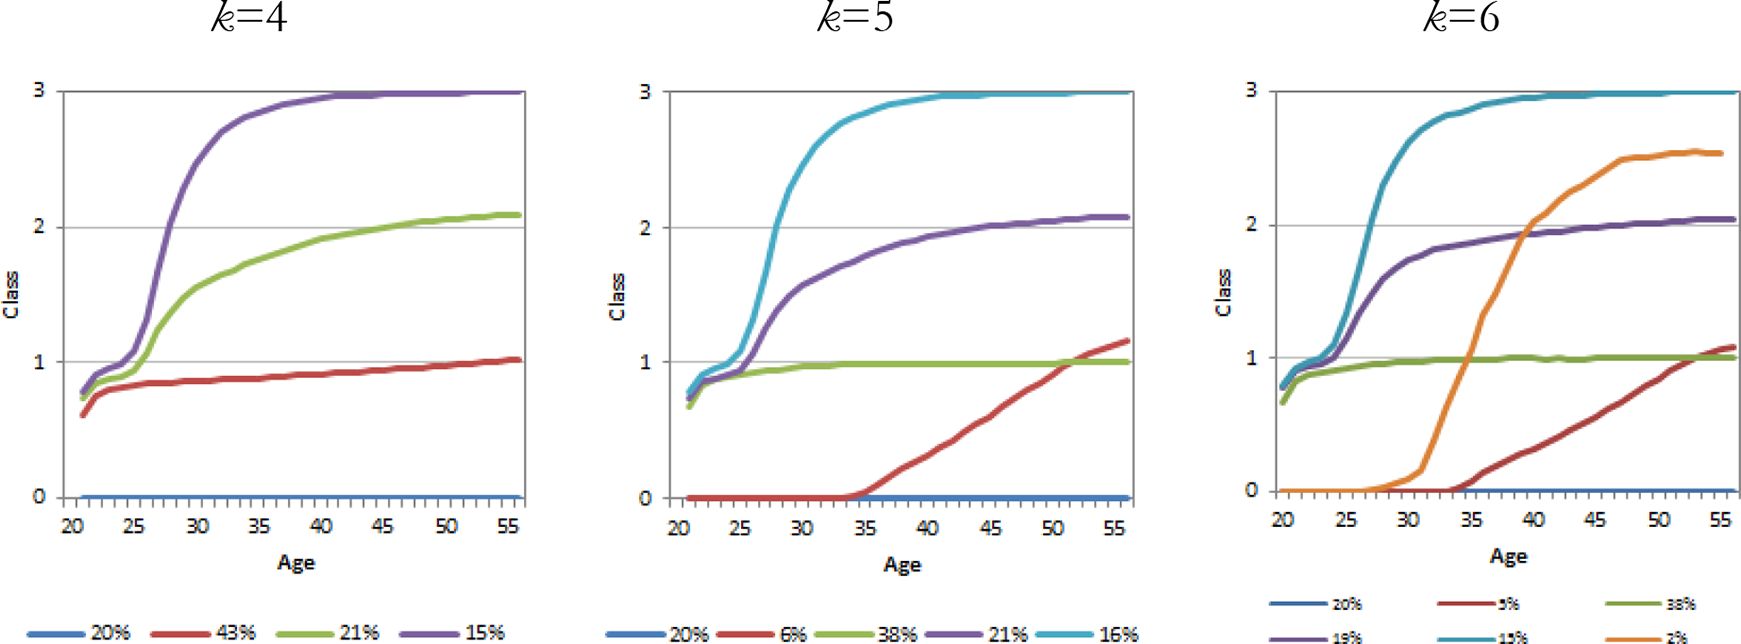
Figure 4

Education trajectories
Figure 5

Pension trajectories
Tables
Table 1
BIC scores and number of sub-groups k
| Outcome | 3 | 4 | 5 | 6 |
|---|---|---|---|---|
| Earnings (N=3,325) | −50288.7 | −48178.8 | −45974.7 | −46375.9 |
| Education (N=13,173) | −549399.6 | −544342.9 | −537412.2 | −535026.8 |
| Pension (N=10,761) | −834881.4 | −811092.8 | −786210.9 | 786234.1 |
-
Notes: BIC = log(L) −.5 * log(n) k, where L = log likelihood, n = sample size and k = number of parameters.
Table 2
Composition of earnings trajectories at age 60, per cent
| G1 (8%) | G2 (11%) | G3 (17%) | G4 (29%) | G5 (35%) | Total | |
| Active first year | 0.8 | 2.3 | 2.3 | 0.5 | 3.4 | 2.1 |
| Active second year | 0.4 | 0.6 | 0.7 | 0.3 | 0.9 | 0.6 |
| Active (working) | 2.3 | 51.1 | 1.2 | 89.9 | 54.2 | 50.6 |
| Unemployed or in education | 1.5 | 9.7 | 6.2 | 1.6 | 10.4 | 6.5 |
| Sickness benefits | . | 1.1 | 0.4 | . | 2.5 | 1.1 |
| Partial disability pension and active | . | 1.4 | 0.2 | 2.3 | 0.4 | 1 |
| Partial disability pension and non-active | 0.8 | 1.1 | 0.9 | . | 0.7 | 0.6 |
| Full disability pension | 23.4 | 2.8 | 26.9 | 0.5 | 2.9 | 7.9 |
| Full disability pension second year | 1.1 | 1.4 | 3.4 | . | 2 | 1.6 |
| Old-age pension | . | . | 0.5 | 0.1 | 0.7 | 0.4 |
| Only national disability pension | 15.5 | . | . | . | . | 1.2 |
| Out of labor markets I | 18.9 | 1.4 | 17.2 | 0.3 | 1.8 | 5.3 |
| Out of labor markets II | 14.3 | . | 2.5 | . | 0.8 | 1.9 |
| Inactive | 5.7 | 18.8 | 30.8 | 1.5 | 15.5 | 13.8 |
| Deceased | 15.5 | 8.2 | 6.9 | 2.8 | 3.8 | 5.5 |
| Total | 100 | 100 | 100 | 100 | 100 | 100 |
Data and code availability
The data used in the study is from ELSI-microsimulation model. The policy regarding ELSI is; Proprietary, with executable not available.
The statistical model used in the article (in SAS-environment) is given in the article Appendix.
Download links
A two-part list of links to download the article, or parts of the article, in various formats.