SWITCH: A Tax-Benefit Model for Ireland Linked to Survey and Register Data
- Economic and Social Research Institute, Ireland
Abstract
This paper describes the development and operation of the SWITCH model, a tax-benefit microsimulation model for Ireland which is linked to survey and register data. SWITCH is based on the EUROMOD platform but has important advantages over the Irish component of EUROMOD, including a “current income” concept, detailed information on benefit receipt in the underlying data and the modelling of non-cash benefits. We discuss the process of creating an input dataset, including reweighting and uprating. We validate the model’s simulation of the income distribution with respect to a range of external sources and suggest future improvements.
1. Introduction
Changes to the income tax and social welfare system have the potential to impact upon the incomes of most, if not all of the population. Policy changes are often considered in terms of their effects on a number of “hypothetical families”. For example, in Ireland, analysis of the annual Budget often looks at specific types of people (e.g., a single person on the minimum wage, a lone parent with two children, one and two-earner couples on the average wage etc.). This approach has strong limitations as families within this category differ in terms of income, housing tenure, number of children and other characteristics that affect their tax-benefit position. More fundamentally, analysis of hypothetical families - no matter how well chosen - simply cannot give an overall picture of the impact of a policy change on incomes and work incentives at the population level. The use of tax-benefit microsimulation models, which are based on large-scale, nationally representative samples of households or rich administrative data, can provide a more representative picture of the impact of policy changes.
Microsimulation modelling has been used in the measurement of poverty and inequality for decades. This framework allows the simulation of income distributions for a given population, income structure and tax-benefit system. These income distributions are often also recoverable from the survey or administrative datasets underlying microsimulation models. However, linking these data to a microsimulation model allows the computation of counterfactual or “what-if” scenarios which is not possible using the underlying data alone. The ability to create counterfactual income distributions is critical to policy-makers and researchers who wish to estimate, for example, how the distribution of income will change due to population ageing (Dolls et al., 2019), if unemployment increases (Dolls et al., 2012) or if the parameters of the tax-benefit system change (Paulus and Tasseva, 2017). Well known microsimulation models include EUROMOD (Sutherland and Figari, 2013) for Europe; TRIM (Giannarelli et al., 2007) for North America and TaxBEN (Immervoll and Barber, 2006) for OECD countries.
The European Commission develops and maintains the harmonised European microsimulation model, EUROMOD. The first Irish policy system to be included in the EUROMOD model dated from 1998. Since then, the Irish component of the EUROMOD model has been used mainly for academic work in single country studies (Bargain and Doorley, 2011; McQuade et al., 2017) or comparative European work (Paulus et al., 2020; Sologon et al., 2021; Doorley et al., 2021). While an invaluable tool, there are some drawbacks to the EUROMOD model from a policy-maker perspective and these mainly stem from the limitations of the underlying data.
Broadly speaking, three types of data source can be linked to a microsimulation model. Survey data, such as the EU Statistics on Income and Living Conditions (EU-SILC), tend to be most straightforward to access and are widely used. Alternatively, administrative or register data can be linked to either EUROMOD or to a national model but these tend to be subject to strict access rules and do not always contain rich demographic information. A third option combines survey data with some administrative data to allow a more accurate simulation of income, benefit eligibility and tax liabilities.
The data underlying the Irish component of the EUROMOD model is EU-SILC in which the data reference period is the year prior to the data collection period. This results in a mismatch between the income reference period and policy rules/employment information. This coupled with the fact that the data underlying the EUROMOD model is not reweighted/nowcasted to match detailed employment or income control totals for the year of collection or, indeed, the current year, means that the simulated distributions of income, benefit receipt and tax revenue can be difficult to validate against external benchmarks. Additionally, EU-SILC contains aggregated rather than detailed information on benefit receipt. This makes the modelling of contributory and non-contributory benefits difficult as, without information on which particular benefit an individual is in receipt of, the researcher cannot determine this independently as social security contribution history is not available in EU-SILC. It is for these reasons that the Economic and Social Research Institute (ESRI) develops and maintains a separate microsimulation model of the Irish tax and benefit system. The model is used internally at the ESRI and is also provided to civil servants and the staff of the Parliamentary Budget Office (PBO).1
The ESRI’s microsimulation model, SWITCH (Simulating Welfare, Income Tax Childcare and Health policies) is based on data drawn from the Survey on Income and Living Conditions (SILC) which is carried out by the Irish national statistical agency – the Central Statistics Office (CSO). This dataset falls into the third category described above – it is primarily a survey dataset but is linked to administrative information on current income and welfare. Using this dataset, rather than EU-SILC allows us to use a “current” concept for income and to model contributory and non-contributory benefits more precisely. Due to the more extensive set of variables provided in the national version of SILC, we can also model non-cash benefits, which is not possible with EUROMOD. This allows us to create a model that is more precise and easily validated against external benchmarks. Further advantages of the model include nowcasting of the underlying data and detailed automated results tailored to policy-makers.
The SWITCH model has been in operation for three decades and both policy makers and researchers have published extensively using the model (see, for example, Doorley et al., 2021; Boyle, 2018; Department of Social Protection, 2021, 2022; Bargain et al., 2017; Keane, 2015; Callan et al., 2006; 2014a; Callan et al., 2014b; Baicker et al., 2013; Callan and Sutherland, 1997; Bargain and Callan, 2010). A recent European Commission report indicates that policy makers in Ireland perform systematically more Distributional Impact Analysis than most other member states around Budget time and the SWITCH model underpins much of this analysis (Fiorio, 2021).
In 2020, the ESRI undertook a project to redesign the model and the underlying software to keep pace with international developments and provide more model flexibility. The updated SWITCH model, while retaining its advantages over the Irish component of EUROMOD, is now based on the EUROMOD platform, facilitating cross-country comparison, and uses the most recent pre-pandemic data available, SILC 2019. This paper describes the development and operation of the SWITCH model. The EUROMOD platform and the process of creating an input database for the model is discussed. Ensuring the model runs on a representative sample of the Irish population is essential to model accuracy and we discuss adjustments made to the underlying data to improve representativeness, such as reweighting and uprating. The simulation process is discussed along with the capabilities of the model in terms of results produced. We also present a model validation and show how the reweighting process helps improve the accuracy of the model.
2. The EUROMOD Platform
EUROMOD is the tax-benefit microsimulation model for the European Union. It is maintained by the Joint Research Centre (JRC) of the European Commission, in collaboration with Eurostat and national teams from the EU countries. The Taxation, Welfare and Pensions team at the ESRI operate as the national team for the Irish component of EUROMOD. The model is open-source and consists of three main components – the software, the coded policy rules and the input data. The model consists of a set of xml files which contain the coded policy rules. The input data of the model is mainly based on the EU-SILC User Database (UDB).2, The EU SILC survey is coordinated by EUROSTAT with CSO Ireland carrying out the survey in Ireland and supplying the data to EUROSTAT. The survey focusses on the income and living conditions of households in Ireland with a focus on poverty, deprivation and social exclusion. While the model itself is open-source, access to the input data (based on the EU SILC UDB) must first be authorised by EUROSTAT. The model has a flexible user interface that allows users to adjust tax-benefit parameters.
The model is also flexible in terms of input data – the data simply needs to be created in a harmonised manner to run with the EUROMOD platform. In some countries researchers have used alternative datasets to create an alternative input dataset for use with the EUROMOD model – for example, the use of administrative data in Greece.3
Simplified online tax-benefit calculators which use the EUROMOD platform exist for some countries such as the SORESI model for Austria or the EUROMOD-JRC Interface which allows users to simulate non-complex tax and benefit reforms without prior knowledge of the EUROMOD model and without the need to apply for data access.4,
While the EUROMOD model covers Ireland, the SWITCH model, which is the focus of this paper, uses the EUROMOD platform along with a more detailed dataset to analyse tax-benefit changes. The key differences between the EUROMOD and SWITCH model are discussed throughout the paper and briefly summarised in Box 1 of the Appendix.
Ideally tax-benefit models would be based on administrative data capturing the entire population but this is not always possible. Administrative data, which is often subject to more restrictive access rules, may provide more accurate and timely information on income. Some drawbacks to administrative data include the limited demographic information they contain and the fact that observations are sometimes limited to taxpayers. This sometimes means an under-representation of the lower end of the income distribution (who may not pay tax) and difficulty in simulating the effect of policies on non-taxpayers. The use of administrative data may be further complicated by national statistical agency’s rules on data usage and reporting. Sometimes, the data must be used on the Virtual Desktop Interface of a statistical agency with a statistician charged with checking that statistical disclosure rules are not violated before results are transferred to the user’s own PC. The TAXIPP model used at the Institut des Politiques Publiques in France is an example of a national microsimulation model based on administrative data (Ben Jelloul et al., 2017).5
In Ireland, while administrative data on market incomes and social welfare income is available from the Revenue Commissioners and the Department of Social Protection (DSP),6 respectively, two main issues prevent the usage of such administrative data for microsimulation modelling in Ireland. Simulating tax and welfare entitlements depends on factors such as the number and ages of all household members. Those not in receipt of income (such as children, inactive adults) do not appear in these administrative records and Ireland does not have a population register as exists in many other countries. Benefit entitlements often also depend on other factors. For example, couples with children whose incomes are below the relevant income limit for the in-work income support, the Working Family Payment, must work at least 38 hours per fortnight combined and hours of work information is not available in income tax data. Simulating entitlements to additional benefits such as Medical Cards (the Irish public health insurance scheme) and to subsidies under the National Childcare Scheme is also only possible based on information not recorded in administrative data, such as hours of childcare used, housing costs paid etc.
For these reasons, the SWITCH model uses data from the CSO Ireland’s Survey of Income and Living Conditions (SILC). SILC is part of an EU-wide programme and surveys a sample of Irish households. The survey covers a wide range of issues, with a focus on income and living conditions, and is the official source of poverty indicators. The survey is carried out annually (since 2004) and normally covers around 4,000 private households/10,000 individuals each year. The most recent pre-COVID19 data year available, 2019, is the current dataset used in SWITCH. The survey captures information on all household members, and their relationships along with their types and levels of incomes, labour force status and work hours. This information is essential to accurately model income tax liabilities and entitlements to benefits. The majority of income information is captured from administrative sources such as Revenue and the Department of Social Protection which improves the accuracy of the data. For more information on the SILC data, see CSO (2020).
While the EU-SILC UDB data (provided to EUROSTAT by the CSO Ireland) is based on the same survey, the CSO Ireland provide a more detailed version of the SILC data that is only available under strict access conditions – the Researcher Microdata File (RMF). This contains more detailed information than the UDB version – for example in the UDB some benefits are aggregated together such as contributory and non-contributory pensions. This is an important difference between SWITCH and EUROMOD as information on the type of benefit received in reality is sometimes used in identifying eligibility to a particular payment (see Section 4.1 for more detail on this). Additional variables are also provided in the RMF compared to the UDB that improve the accuracy of the SWITCH model compared to EUROMOD – for example month of birth is provided in the RMF but not the UDB – this information can be used to identify a child’s entitlement to publicly funded pre-school, the Early Childhood Care and Education (ECCE) scheme, eligibility for which depends on the precise age of the child in months.
Another important distinction between SWITCH and EUROMOD is the income reference period. The input data prepared for SWITCH focusses on current income, most of which is drawn from administrative sources.7 The focus of EUROMOD and, more generally, of SILC and EU-SILC data is annual income, where the income reference period is the previous year. Poverty rates calculated by CSO Ireland and Eurostat are based on annual employment and benefit income. While this makes sense in examining changes in income levels and calculating poverty rates, tax liabilities and welfare entitlements depend on current income and labour market status. For example, an individual who was unemployed at some point during the previous year and received an unemployment benefit at that time might be employed at the date of interview, with no current entitlement to unemployment benefits. Likewise an unemployed individual eligible for Jobseeker’s Allowance, the means tested unemployment benefit, will be means tested based on their current income as opposed to their annual income.
The SILC questionnaire asks about receipt of social welfare payments over the course of the previous year. However, the CSO Ireland also links the survey data to administrative information from the DSP which indicates what (if any) benefits are currently received by the respondent. The last (usually weekly) amount is also provided. This allows us to identify a person’s current benefit entitlement which may be used in identifying an individual’s eligibility for a particular benefit scheme in the model. For example, knowing if an individual is currently unemployed does not provide sufficient information to determine the type of unemployment benefit they may be eligible for, as the SILC data does not contain social security (PRSI) contribution histories which determine which kind of Jobseeker’s support is granted.8
2.1. Data Checks and Imputations
Research using data such as SILC may involve dropping observations if certain important variables are missing. Given the importance of family relationships and income levels in simulating tax liabilities or benefit entitlements (e.g., a person’s benefit amount may be means tested and therefore depend on their partners income level), dropping one individual due to missing values would necessitate dropping the entire household. Given that more than 100 variables from the RMF are used in the SWITCH input database, dropping observations with missing information could shrink the sample significantly and would have significant implications for the representativeness of the data. Therefore, we use imputation rather than dropping observations wherever possible.
For most of the variables, the process of preparing them for use in the SWITCH database is straightforward and usually involves replacing the name of the variable in the RMF with a new name which follows the EUROMOD variable naming protocols and therefore allows the SWITCH model to run. Some initial checks are performed when first creating the data, particularly for ID’s. For example, corrections for duplicate ID’s, non-respondents and inconsistent weights between members of a household are performed. Occasionally, a variable may have a value that is deemed implausible or an extreme outlier.9 These are dealt with on a case-by-case basis and are either top-coded or replaced as missing values and imputed in a sensible manner.
It is also necessary to check the logical consistency of variables. Examples include:
Ensuring employment income is positive if the labour market status is employed.
Checking the partner’s ID exists if an individual is married, and that this ID does indeed correspond to the partner.
If an individual’s current education status is post-graduate, their highest education level attained is undergraduate.
Corrections for inconsistencies are possible given the granularity of the data at hand, both for cases where the information is inconsistent or missing. Imputations are commonly used to replace missing values in such cases. For instance, in the first example, a predicted wage is calculated using data on age, industry, gender, education, etc. Other variables which are imputed when missing include education status, hours worked and property market values.10
The method for imputing missing observations changes from variable to variable. A common solution is to replace the missing value with the mode of the variable, as is done in the case of citizenship (replaced as Irish) or month of birth (replaced with February as the first quarter is the most frequent). Others can be imputed using information contained in closely related variables. For example, individuals whose disability status is missing is imputed to “yes” if the data indicates that this individual is in receipt of any disability benefit or similarly relevant payment. The imputation method for education variables requires careful consideration of multiple variables, thus making it one of the more problematic to impute.11 This is particularly true as the imputation of subsequent education variables (e.g. highest education level attained) rely on the successful imputation of related variables that precede (current education).
While most variables can be brought into SWITCH without great modification, some require further steps for construction and more precise simulation. For example, due to a lack of information regarding a person’s social security contribution history, receipt of a particular benefit as captured in the data provided by DSP may not be sufficient to accurately model benefit entitlements. The State Pension (Contributory) has different rates depending on social security contribution history. The administrative information on the last amount received of this benefit allows us to construct a flag indicating which level of payment an individual is entitled to and is used in the model to assign the correct rate.
2.2. Uprating
As the data for the model is taken from the most recent year of SILC available, 2019, monetary amounts such as incomes must be adjusted to current levels. Monetary values are adjusted to the current year by using relevant ‘uprating factors’ in the model. The uprating factors used in SWITCH and EUROMOD are identical.
A variety of sources are used to adjust income (Table 1). Employment income and self-employment income are likely to grow at different rates over time, so an appropriate uprating factor is used for each. In the case of an uprating index not being available – as is often the case when the policy system relates to the following year – forecasts for GDP/GNP growth are used for employment and self-employment income respectively.
Uprating Factors
| Index | Source | Income components uprated |
|---|---|---|
| Average earnings per week, € | https://cso.ie/px/pxeirestat/Statire/SelectVarVal/Define.asp?maintable=EHQ03&PLanguage=0 | Employment income |
| Self-employed income (2006=1) | https://www.cso.ie/px/pxeirestat/Statire/SelectVarVal/Define.asp?maintable=RVA01&PLanguage=0 up to 2018, GNP per capita after 2018 | Self-employed income |
| GDP per capita (2007=1) | https://statbank.cso.ie/px/pxeirestat/Statire/SelectVarVal/Define.asp?maintable=NQQ40&PLanguage=0 | Investment income |
| https://cso.ie/px/pxeirestat/Statire/SelectVarVal/Define.asp?maintable=PEA01&PLanguage=0 | ||
| Consumer price index (2007=1) | https://www.cso.ie/px/pxeirestat/Statire/SelectVarVal/Define.asp?maintable=CPA01&PLanguage=0 | Non-simulated benefits, asset income, benefit-in-kind, expenditure. |
Uprating incomes in a homogenous manner like this may be flawed if income grows at a different rate for low and high earners (Jenkins and Van Kerm, 2006; Jenkins and Van Kerm, 2016; Darvas, 2021). During the pandemic, there was heterogeneity in how industries and occupations fared so this is certainly likely to be the case recently. Unfortunately, there is no series of income currently available which would allow us to uprate incomes in bands to the current period.
2.3. COVID employment shock
While incomes in the SWITCH model are uprated to current levels, the SWITCH model usually assumes a ‘constant’ population i.e., the demographic and economic characteristics of the population (such as the age and employment profile) are assumed to remain constant at the year the SILC data was collected. The model does, however, allow for the implementation of changed economic conditions. Given the substantial impact of the COVID 19 pandemic on employment rates, the 2019 data must be adjusted in order to be representative of the 2021 population in terms of unemployment rates. O’Donoghue et al. (2020) does this via a sophisticated nowcasting approach using the NUI Galway microsimulation model. Almeida et al. (2021) employ a reweighting method linked to macroeconomic scenarios in the EUROMOD model. In the SWITCH model, we opt for an ‘unemployment shock’ whereby a certain proportion of workers in an industry are assumed to have either lost their job or to have been placed on the wage subsidy scheme put in place to retain jobs – the Temporary COVID-19 Wage Subsidy Scheme (TWSS). The number of individuals to either lose their job or receive the TWSS (or its successor, the EWSS) is calibrated from publicly available CSO Ireland data on the number of people in receipt of the Pandemic Unemployment Payment (PUP),12 the additional unemployment benefit introduced in response to the pandemic, and from Revenue data on the number of recipients of the EWSS.13 Both account for the industry breakdown of recipients of either scheme. Extra weight is given to workers under 25 in the employment shock simulations as administrative data shows that this group was hardest hit by pandemic related unemployment. The proportion of workers simulated in each age and gender category to be receiving the PUP and TWSS is compared to CSO Ireland statistics in August 2020 in Figure 1. Overall, we can see that the simulation of those in receipt of the PUP and wage subsidies compares well with official estimates along gender and age grounds.
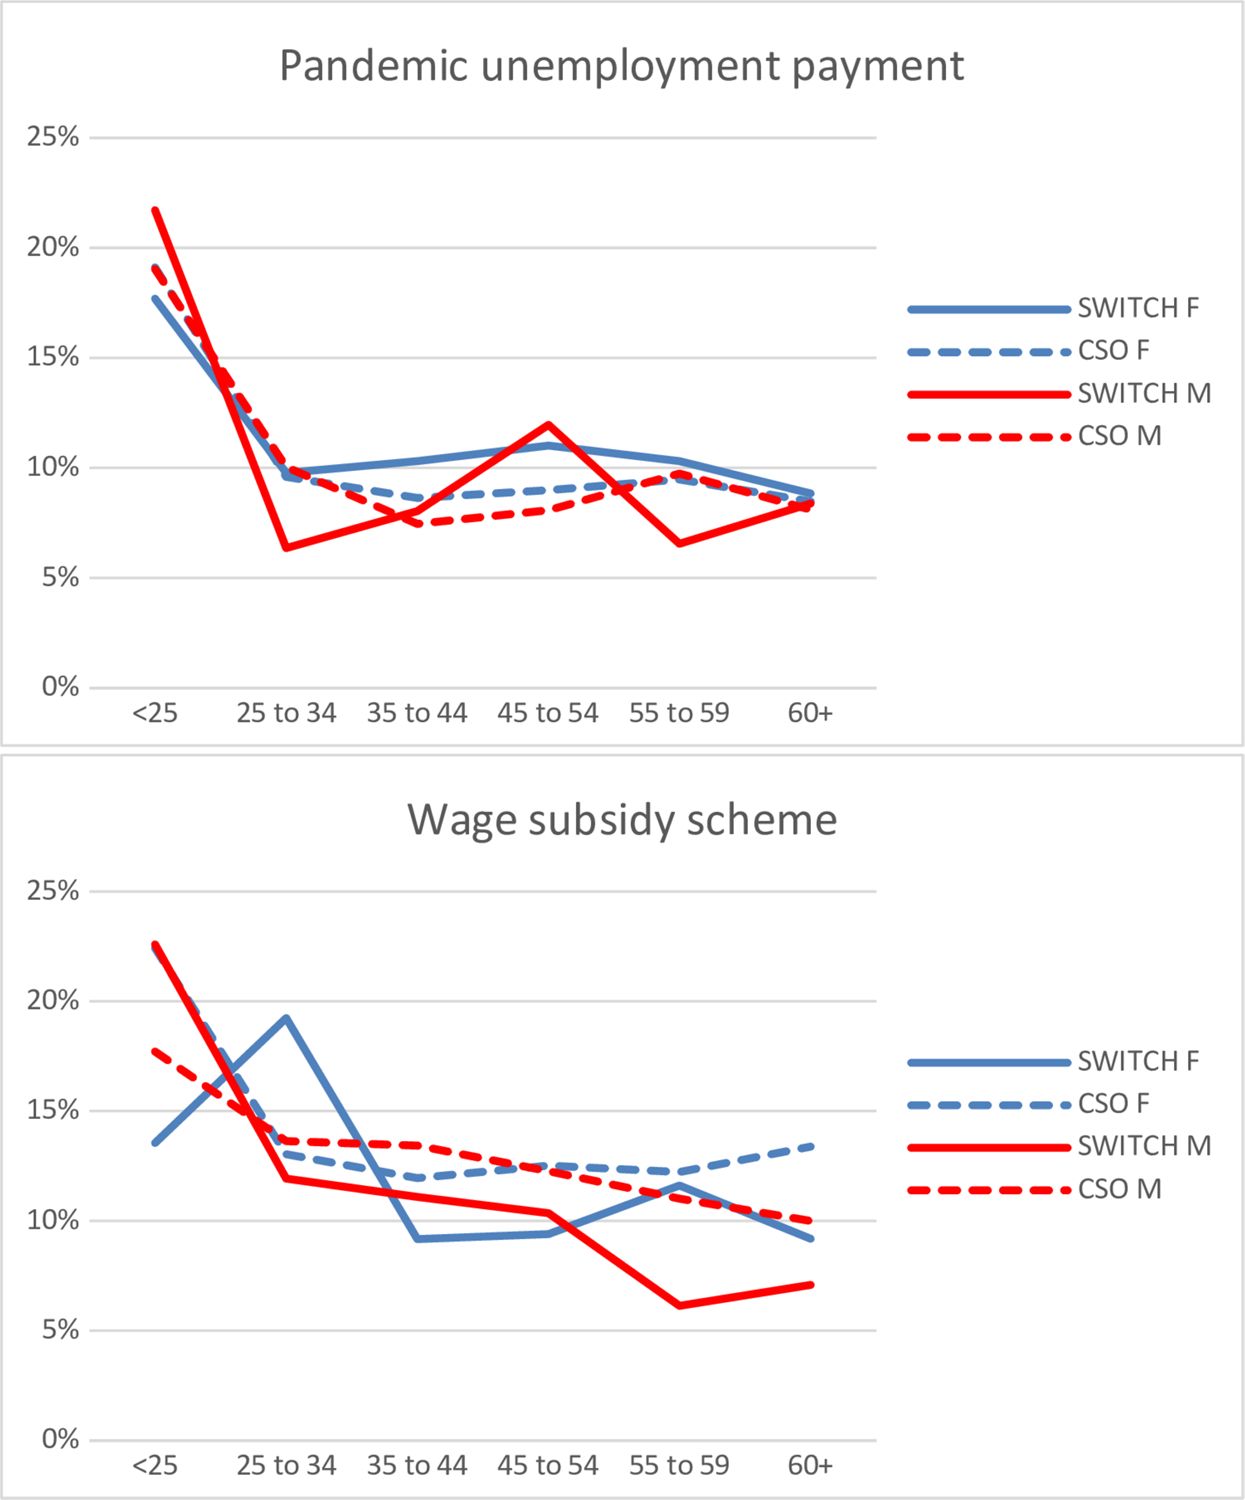
The proportion of workers receiving the PUP and the wage subsidy by gender and age category in August 2020. Note: SWITCH simulations are based on v2.1 F indicates female, M indicates male.
These calibrations can be changed by users of the model to reflect PUP and TWSS numbers at the time of analysis or estimated future numbers. Likewise, the unemployment shock can be omitted so that unemployment rates remain at 2019 levels if users wish to simulate the forecast income distribution when unemployment is back to pre-pandemic levels.
2.4. Reweighting
The CSO Ireland weighting process creates household cross-section weights for use with the SILC data.14 First, a design weight is assigned to each household, which is the inverse proportion to the probability with which the household was sampled. These weights are further adjusted depending on when the household was first interviewed as there is a panel element to the SILC survey and households are included for four years. The aim of the approach is that the weighted estimates reproduce the control totals of certain benchmarks. The benchmark estimates that CSO Ireland uses are:
Population estimates by sex and age group (0-14, 15-34, 35-64, 65 and over) based on population projections from Census data.
Household population estimates at regional level using the eight NUTS3 regions. These are generated using the Labour Force Survey (LFS).
Household composition estimates (6 categories, depending on number of adults and children) which are also drawn from the LFS.
Although these controls ensure that SILC is representative of the key demographics of the Irish household population, the representativeness of the social welfare population and the income tax base are not guaranteed. Once the CSO Ireland original 2019 weights are applied to the data, a larger number of unemployed individuals are present in the data compared to administrative statistics. A similar problem occurs when examining the income distribution whereby the distribution of taxpayers differs to the distribution of taxpayers shown in administrative records from Revenue. The same is true, to a lesser extent, for the numbers receiving certain benefits – these can differ compared to administrative information from the Department of Social Protection. More detail on these differences is provided in Section 5 which discusses how the model is validated.
The more precise the depiction of the labour force, benefit recipients and the income distribution is in the input data, the more accurate the SWITCH model will be in terms of income tax estimates, benefit recipient numbers etc. For this reason, we reweight the data by adding controls based on administrative data concerning the tax and welfare system as well as official statistics based on the CSO Ireland’s LFS.
Our approach is similar to Almeida et al. (2021) who analysed the impact of the pandemic on EU households’ income. The problem that they faced was that available input data did not capture the labour market changes that occurred during the pandemic. To overcome this, they modified the population structure of SILC to mimic the aggregate employment, unemployment and total wage compensation. In our case, we are not interested in a more exact capture of the labour market (as we implement the COVID employment shock in a different manner) but of the recipients and the distribution of the tax and welfare system in the year in which the data is collected.
Compared to the more detailed LFS, which is used to produce the official measure of employment and unemployment in Ireland, SILC 2019 (using the original 2019 weight) has a lower number of employees and higher number of unemployed persons – specifically SILC has 10% fewer employees and 12% more unemployed persons than the LFS.15 The issue of higher numbers of people not in work in SILC (using the CSO Ireland weight) was also identified in Watson et al. (2015) – they find a gap in the number of adults in employment when compared with the main labour force data for Ireland (at the time the Quarterly National Household Survey, since replaced by the LFS). This gap also exists with the Census, which is not based on a sample of the population but captures the entire Irish population – they therefore concluded that ‘the SILC survey was under-estimating the percentage of people at work’. In order to better capture the labour market situation, we control for the number of employed and unemployed individuals using statistics from the LFS.16 Even when the numbers of employed and unemployed are controlled for, the breakdown of those eligible for non-means-tested and means tested unemployment benefits (i.e., Jobseeker’s Benefit (JSB) and Jobseeker’s Assistance (JSA)) cannot be guaranteed. The same issue arises with pension receipt – those with sufficient lifetime PRSI contributions receive the non-means-tested State Pension (Contributory) while those without sufficient contributions receive the means-tested State Pension (Non-Contributory). For this reason, we also control in the input data for benefit recipients for the main benefit schemes.17 Benefit recipient numbers are taken from administrative data – namely the DSP who report the annual recipient numbers in receipt of each benefit. We also reweight the data to match administrative data about the income distribution (specifically from Revenue’s income distribution statistics which report the number of tax units in income bands) to improve the precision of tax liability simulation. As data for the 2019 income distribution were not available, we use previous income distributions (year 2015 to 2018) for employees (Schedule E income) and self-employed (Schedule D income) and constructed the forecasted income distributions for the two categories for 2019.18
Lastly, to capture the demographic profile of the Irish population, we applied the demographic controls that CSO Ireland use in their weighting process, but with some additions. While the CSO Ireland weight ensured the data captured wider age bands by gender as reported in population level statistics taken from the Census (specifically the number of males and females aged 0-14, 15-34, 35-64 and 65 and over) differences occurred within those age bands – for example the 35-64 age band is relatively large so differences emerged between the numbers in narrower 5-year age bands within this group when compared to the Census.19 This may have implications for tax liabilities and benefit entitlement (for example, earnings tend to rise with age, maternity benefit entitlement is concentrated in certain female age ranges, etc.). Larger differences emerged for the number of females in narrower age bands. Therefore, to better capture the female population, we controlled for smaller five-year age group bands for female individuals based on projected Census data from the CSO Ireland. The wider male age bands used already matched more closely when examined at narrower age bands so no additional controls were used for males.
A summary of the elements controlled for in the weighting process is shown in Table 2 below.
Control Totals Used in Weighting Process
| SILC control totals | SWITCH control totals | Source for controls |
|---|---|---|
| Household location (8 NUTS3 regions) | Household location (8 NUTS3 regions) | LFS (CSO Ireland) |
| Household composition | Household composition | LFS (CSO Ireland) |
| Demographics: 4 age groups by sex | Male demographics: 4 age groups | Projected Census (CSO Ireland) |
| Female demographics: 5 year-band age groups up to 64 and one for all above 65 years old | Projected Census (CSO Ireland) | |
| Employment and unemployment levels | LFS (CSO Ireland) | |
| Forecasted income distribution for employees and self-employed | Office of the Revenue Commissioners | |
| Number of recipients of key benefits | Annual Statistics Report of the Department of Social protection |
For the reweighting process, similar to Almeida et al. (2021), we used the sreweight command in Stata, created by Pacifico (2014), together with the distance function proposed by Deville and Sarndal (1992) which keeps the calibrated weights within a known range set. The command is used to adjust survey weights so that the data matches known control totals for given variables.
For the current version of the model (SWITCH v.4.5), we opt to reweight the input data to match the collection year i.e., we use information on the income distribution, benefit recipiency and demographics in 2019. Past versions of the model have used forecasts of these characteristics to create a dataset for the model that is representative of a future point in time e.g., the 2021 population. This would complement the uprating factors applied that allows model users to adjust incomes to 2021 or 2022 levels. However, given the uncertainty surrounding how the employment situation, income distribution and benefit recipiency population will look in the coming months and years due to the impact of the pandemic, forecasts of such characteristics are likely to be unreliable. We therefore feel it is more prudent to reweight the data to the collection year. The simulation of a pandemic-related employment shock can then be used in conjunction with the reweighted data to create a more realistic ‘future’ profile of the population. This approach also allows users to look at different pandemic-related employment scenarios.
3. Model simulation, Capabilities and Results
3.1. Simulation of Tax Liabilities and Benefit Entitlements
The SWITCH model simulates the disposable income each family would obtain under a set of income tax and social welfare policies, and under an alternative policy of interest. The policy change under consideration could be a simple change to one tax rate or a complex programme of tax and welfare reform. Income tax, Universal Social Charge (USC), Pay Related Social Insurance (PRSI) and property tax are all simulated in the model. Other taxes, such as indirect taxes on consumption, are not included in the model as the SILC data does not contain information on expenditure.20
Regarding social welfare schemes, benefits can be either fully simulated, part-simulated or non-simulated as indicated in Table 3. Benefits are fully simulated if all the information needed to identify entitlement is known in the underlying input data. For example, Child Benefit receipt is dependent only on child age, so it is fully simulated. One-Parent Family Payment entitlement is related to the household arrangement of an individual with children (non-partnered), their age (under 66) and their weekly means. As all this information is present in the data, benefit entitlement and amount can therefore be fully simulated.
Simulated and non-simulated social welfare schemes
| Scheme | Simulation Status |
|---|---|
| Child Benefit | Fully Simulated |
| Early Childhood Care & Education Scheme | Fully Simulated |
| Job Seekers Allowance | Fully Simulated |
| Job Seekers Benefit | Fully Simulated |
| Jobseekers Transitional Payment | Fully Simulated |
| Maternity Benefit | Fully Simulated |
| National Childcare Scheme | Fully Simulated |
| One-Parent Family Payment | Fully Simulated |
| Pandemic Unemployment Payment | Fully Simulated |
| Rent or Mortgage Supplement | Fully Simulated |
| State Pension (Non-Contributory) | Fully Simulated |
| Temporary Wage Subsidy Scheme | Fully Simulated |
| Widow’s Non-Contributory Pension | Fully Simulated |
| Working Family Payment | Fully Simulated |
| National Childcare Scheme | Fully Simulated |
| Early Childhood Care and Education Scheme | Fully Simulated |
| Medical and GP visit card | Fully Simulated |
| Employment Wage Subsidy Scheme | Fully Simulated |
| Pandemic Unemployment Payment | Fully Simulated |
| Carer’s Allowance | Part-simulated |
| Disability Allowance | Part-simulated |
| Fuel Allowance | Part-simulated |
| Illness Benefit | Part-simulated |
| Injury Benefit | Part-simulated |
| Invalidity Pension | Part-simulated |
| State Pension (Contributory) | Part-simulated |
| State Pension (Transition) | Part-simulated |
| Supplementary Welfare Allowance | Part-simulated |
| Widow’s Contributory Pension | Part-simulated |
| Education Grant (from FAS) | Non-simulated |
| Grants/Education (Training) Allowances | Non-simulated |
| Household Benefits Package | Non-simulated |
| Minor Social Assistance Benefits* | Non-simulated |
| Non-Irish Social Welfare Payments | Non-simulated |
| Residual Family Allowances† | Non-simulated |
-
*
This aggregate benefit is composed of monies received from charities and local government
-
†
This aggregate benefit is composed of Back to School Clothing & Footwear Allowance, Carer’s Benefit, Deserted Wife’s Allowance, Deserted Wife’s Benefit, Guardian’s Payment Contributory, Guardian’s Payment Non-Contributory, Special Diet Supplement
Part-simulated schemes are those for which eligibility is taken from the underlying data as it is not fully possible to simulate eligibility using SILC data. For example, the input data does not have sufficient information regarding someone’s disability status or illness duration. Entitlement to Disability Allowance and Illness Benefit are therefore taken from the underlying data i.e., they are simulated to be entitled to the benefit if the linked register benefit information in SILC indicates that they are currently in receipt of these payments. Another example is the part-simulation of the State Pension (Contributory) and State Pension (non-contributory). PRSI contribution history over a person’s lifetime is not captured in the data rendering it impossible to distinguish between eligibility for these two payments. Eligibility is therefore taken from the underlying data. In part-simulated schemes, the amount received by those eligible is modelled - this allows model users to simulate a change in rates if desired.
A small number of schemes are non-simulated. Non-simulated schemes are those for which eligibility and the amount received is taken from the underlying data. This is usually due to the fact that the underlying data does not contain sufficient information to simulate entitlement, nor does the DSP register information capture receipt – for example those getting a maintenance grant under the Student Grant Scheme or those receiving welfare benefits from abroad. For these schemes, usually smaller ones, some are aggregated together in order to facilitate the reporting of results.
As well as the standard cash benefits, the SWITCH model also calculates entitlement to two main categories of non-cash benefits. The first are forms of public health insurance - Medical and GP-Visit Cards. Medical Cards provide free primary, community, and hospital care, as well as heavily subsidised prescriptions drugs, for those below specific income means-test threshold.21 GP-Visit Cards cover the cost of attending a GP only and are also generally granted based on a means test (with the income limit being higher than that of a Medical Card). Certain age groups automatically qualify for a GP-Visit Card also (those under 6 and over 70). The second type of non-cash benefits simulated in SWITCH are related to childcare subsidies (payable directly to childcare providers) under the Early Childhood Care and Education (ECCE) scheme and the National Childcare Scheme (NCS). The simulation of these non-cash benefits is mainly of interest to be able to examine the impact of changes to the tax-benefit system on eligibility – for example entitlement to Medical and GP-Visit Cards and NCS subsidies are based on income and are assessed on a net basis. Therefore, any policy changes involving a change in social welfare rates of payment or income taxes will have a knock-on effect on entitlement to these schemes. While distributional analysis generally does not include valuations of these non-cash benefits in the definition of income it is possible to include such valuations, for example to examine the distribution of such benefits across the income distribution or to examine the impact such benefits may have on financial work incentives.
Model users are provided with ‘benchmark’ policy systems which simulate income tax and benefit entitlement under the actual tax-benefit policies in place at a given time. These are provided in a more timely manner than the EUROMOD policy system. For example, a post-Budget release is provided before the end of each calendar year, containing a policy system for the following year. Another release (often based on a new wave of data) is provided during the summer, in the run-up to Budget preparations to ensure that SWITCH users within government Departments have timely access to the most recent data and policy systems. The policy systems provided can be copied and amended as the user wishes. The impact of changing eligibility information for fully simulated social welfare benefits can also be examined, for example by narrowing the age range for Child Benefit eligibility. Users can also simulate ‘new’ taxes or benefits as long as the liability/eligibility information is present in the input data.
The SWITCH model is a ‘static’ one in that it does not take account of behavioural reactions to policy changes that may occur. However, it can be linked to a labour supply model programmed in another statistical software (STATA) to estimate the labour supply effect of, for example, changes to income tax or benefit rates.
Tax Compliance and Benefit Non-Take-Up
The SWITCH model inherently assumes that people are tax compliant i.e. pay the income and property taxes due based on their income and property value levels. In general, for fully simulated benefits, the model also assumes that people avail of benefits to which they are entitled. Two entitlements can be adjusted for non-take-up based on research evidence indicating partial take-up. The first is the Working Family Payment – the in-work support for people with children on low pay. Take-up issues with this scheme have been highlighted over a number of decades and Gray and Rooney (2018), in a qualitative review of WFP recipients, indicate that take-up is still an issue. The SWITCH model therefore allows users to adjust take-up by simulating a random proportion of those eligible for the WFP to not avail of it. Keane et al. (2021) estimated a non-take-up rate of 31 per cent for the means-tested public health insurance scheme, the Medical Card. The model therefore allows the user to set take-up rates for Medical and GP-Visit Cards to take account of the fact that not everyone eligible for one of these benefits actually avails of it.
3.2. Capabilities and Results
At present the capabilities of the model include:22
Estimation of the net budgetary cost of packages of tax and welfare changes. Alternative reform packages with the same budgetary cost can therefore be constructed.
Estimation of the pattern of gains and losses from a policy change. The numbers of families gaining and losing and the size of their gains and losses can be estimated, and the distribution of gains and losses across family types and income levels can be explored.23
Estimation of poverty and inequality measures before and after reform packages.
Estimation of the cost and distribution of non-cash benefits such as Medical Cards, GP Visit cards and childcare subsidies.
Estimation of the gender impact of policy changes at the individual level, assuming full income sharing between members of a couple
While the EUROMOD model allows users to analyse the output data of the model directly, this is not possible by external users of the SWITCH model due to the sensitivity of the underlying data provided by CSO Ireland.24 The model is housed at the CSO Ireland due to this data sensitivity and departmental users access the model remotely. Instead of accessing the output data, an excel ‘results’ file is produced, containing all the result types just listed. This procedure is in place to ensure that the CSO Ireland’s Statistical Disclosure Controls (SDC) are complied with. Each set of tables produced by the SWITCH model is automatically filtered to eliminate the risk of disclosing information on the survey respondents and to ensure that results are based on an adequate sample size.25 In practice, this involves suppressing cells based on averages with fewer than 30 observations or based on percentages with a denominator below 100. While researchers wishing to access SILC data via the CSO Ireland’s Virtual Desktop Interface (VDI) usually have to clear their results with a CSO Ireland statistician before using them, the automatic SDC in place in the SWITCH model allows users to access their results immediately. This ensures timely access to results and also ensures Budget secrecy. In addition, the provision of a standardised results file in excel means that users of the model do not have to be proficient in a statistical package such as STATA to make use of the model.
4. Validation
The SWITCH model, along with the reweighting process described in Section 3.4, is compared to external benchmarks where possible. Doing so allows us to examine in detail how well the model represents the Irish population – a particular focus is on ensuring income levels and benefit recipient numbers compare well to external estimates as these characteristics will be key in determining tax and benefit liabilities and entitlements. This allows users of the model to produce credible results. Where possible, the external benchmarks used are taken from administrative data to ensure that the model results compare favourably to statistics representing the entire (non-survey based) population.
Comparing the total number of tax units in the SILC data when applying the original SILC weights to administrative data from Revenue we see that the total number of taxpayer units is considerably lower in SILC (see Table 4) – Revenue Commissioner administrative information shows 2.2 million taxpayer units in 2019 for annual incomes above €10,000 while SILC only shows 1.6 million.26 This is likely to be due to the fact that, in addition to tax-paying benefit recipients, administrative statistics count all tax-units that worked over the calendar year, even for just a day. SILC, on the other hand, is in effect a snapshot of income and employment status in a given month (the interview month) and thus seasonal or temporal employment is not captured.
Number of Taxpayer Units by Income Bands - Employees and Self Employed
| Gross Annual Income Range | 2019 Admin Estimates* | SILC 2019 weight† | SWITCH revised 2019 weight | ||
|---|---|---|---|---|---|
| N | Ratio to 2019 Admin | N | Ratio to 2019 Admin | ||
| 10000 - 12000 | 83,398 | 67,995 | 82% | 83,398 | 100% |
| 12000 - 15000 | 128,504 | 77,999 | 61% | 128,504 | 100% |
| 15000 - 17000 | 87,411 | 57,914 | 66% | 87,411 | 100% |
| 17000 - 20000 | 132,041 | 93,864 | 71% | 132,040 | 100% |
| 20000 - 25000 | 222,622 | 148,259 | 67% | 222,622 | 100% |
| 25000 - 27000 | 90,614 | 60,305 | 67% | 90,614 | 100% |
| 27000 - 30000 | 128,098 | 81,699 | 64% | 128,098 | 100% |
| 30000 - 35000 | 197,218 | 124,738 | 63% | 197,218 | 100% |
| 35000 - 40000 | 175,005 | 120,624 | 69% | 175,005 | 100% |
| 40000 - 50000 | 246,907 | 169,937 | 69% | 246,907 | 100% |
| 50000 - 60000 | 176,301 | 150,004 | 85% | 176,301 | 100% |
| 60000 - 70000 | 129,339 | 100,134 | 77% | 129,339 | 100% |
| 70000 - 75000 | 52,152 | 34,144 | 65% | 52,152 | 100% |
| 75000 - 80000 | 44,201 | 31,987 | 72% | 44,201 | 100% |
| 80000 - 90000 | 69,282 | 64,746 | 93% | 69,283 | 100% |
| 90000 - 100000 | 51,727 | 76,357 | 148% | 51,726 | 100% |
| 100000 - 150000 | 118,559 | 121,949 | 103% | 118,559 | 100% |
| 150000 - 200000 | 33,656 | 33,653 | 100% | 33,656 | 100% |
| 200000 - 275000 | 17,014 | 13,797‡ | 81% | 17,014‡ | 100% |
| Over - 275000 | 16,264 | 10,380‡ | 64% | 16,264‡ | 100% |
-
Source: Office of the Revenue Commissioners available at https://www.revenue.ie/en/corporate/information-about-revenue/statistics/income-distributions/income-tax-distributions-interactive-tables.aspx
-
*
The last year for which data about the income distribution are available from Revenue is 2018. To align available information about income with the year of collection of the SWITCH input data, we forecasted the 2019 income distribution. The forecasted income distribution was created by applying the average annual change for years 2015 to 2018 to each income band to 2018’s income distribution.
-
†
The weight used in this analysis is the one described in CSO SILC 2019 i.e., it is based on demographics (4 age groups by sex), household location (8 NNUTS3 regions) and household composition.
-
‡
Statistics of lower statistical reliability due to low number of unweighted observations (30-50).
The income distribution of tax units also differs substantially. If left unchanged, these factors would have serious implications for the accuracy of the modelling – for example, in estimating the exchequer impact of income tax liabilities. The reweighting carried out addresses this issue by ensuring that the total number of taxpayer units increases substantially (hitting the target of 2.2 million on incomes above €10,000) and that the income distribution of these taxpayer units matches those of Revenue. We do not control for numbers in the lowest income band (€0 – €10,000). Doing so would present difficulties as the weighting process is arrived at based on employment and self-employment income. Those with zero employment/self-employment income are unlikely to show up in Revenue numbers (as they have no income, therefore no tax liability). This lowest income band may also contain people receiving taxable benefits (i.e., non-employment income) income. In theory most benefits are taxable, but it is unlikely they actually incur a tax liability as an individual’s tax credits will usually cover any liability. Those for whom benefits are their sole income source may therefore also not show up in Revenue numbers. It is usually only those individuals who have an alternative income source (for example rental income or occupational pensions) that will incur a tax liability on benefits received. These issues mean that the numbers in the low-income band as recorded by Revenue will differ from the actual number of low-income individuals in the population, therefore an appropriate, comparable control total does not exist for this income group. This has implications for the simulation of some means-tested benefits, as discussed later in this section.
We also compare how the original SILC data and SWITCH model compares to administrative data on benefit receipt, all for the year 2019. In the reweighting procedure we control for benefit recipients in the input data (i.e., based on the benefit receipt data provided by the DSP in the SILC data) so we provide a comparison of both the input data and the simulated output data to administrative information on benefit receipt.27 This is an additional validation of the policy simulation in the model as, if the benefit recipient numbers in the output data were radically different to the input data, it might suggest an error in the simulation of benefit entitlements in SWITCH. There can be valid reasons, however, why an individual is simulated as receiving a benefit or entitlement but does not report actually receiving it – for example they may be eligible but not take up their entitlement.
We find that, in most schemes, the existing CSO Ireland weight already performs rather well in terms of benefit recipient numbers (Table 5, column (2)). Excluding Maternity Benefit, the original SILC weight captures 90% - 122% of the administrative numbers reported on each scheme (column (1)).28 Regarding Maternity Benefit, some recipients do not receive the payment directly but opt to have it paid directly to their employer, who may top them up to their full pay. These individuals will not be captured in the DSP data linked to SILC. The numbers receiving Jobseeker’s Allowance and Jobseeker’s Benefit appear high in the SILC data using the original 2019 weight when compared to administrative numbers, reflecting the higher number of unemployed people in the SILC data when using the original 2019 weight. Recipient numbers simulated by SWITCH using the original 2019 weight (column (3)) are close to the numbers shown in the SILC (input) data which reassures us that the simulation processes in the model are accurately modelling benefit entitlements.
Benefit Recipient Numbers Comparison, 2019
| (1) | (2) | (3) | (4) | (5) | (6) | |||||||
|---|---|---|---|---|---|---|---|---|---|---|---|---|
| Scheme type | Scheme Name | 2019 Admin* | EUROMOD 2019† | SWITCH revised 2019 weight (output data) | SWITCH revised 2019 weight (input data) | SILC 2019 weight (output data) | SILC 2019 weight (input data) | |||||
| N | Ratio to 2019 Admin | N | Ratio to 2019 Admin | N | Ratio to 2019 Admin | N | Ratio to 2019 Admin | N | Ratio 2019 to Admin | |||
| Pensions | State Pension (Contributory)‡ | 367,133 | 358,098 | 98% | 356,998 | 97% | 367,133 | 100% | 365,237 | 99% | 634,000 | 173% |
| State Pension (Non-Contributory) | 94,854 | 89,117 | 94% | 86,122 | 91% | 94,954 | 100% | 84,846 | 89% | 71,000 | 75% | |
| Widow’s Pension (Contributory)‡ | 115,152 | 128,898 | 112% | 128,898 | 112% | 115,152 | 100% | 115,152 | 100% | 31,000 | 27% | |
| Widow’s Pension (Non-Contributory)‡ | 1,373 | § | § | § | § | § | § | § | § | 9,000 | 655% | |
| Working age income support | Supplementary Welfare Allowance | 15,770 | 16,302¶ | 103% | § | § | 15,770¶ | 100% | § | § | 0 | 0% |
| Jobseeker’s Allowance | 123,633 | 164,390 | 133% | 148,097 | 120% | 123,633 | 100% | 85,139 | 68% | 231,000 | 187% | |
| Jobseeker’s Benefit | 34,141 | 41,523 | 122% | 41,523 | 122% | 34,141 | 100% | 34,141 | 100% | 112,000 | 328% | |
| One Parent Family Payment | 39,533 | 37,405 | 95% | 42,389 | 107% | 39,533 | 100% | 46,006 | 116% | 107,000 | 271% | |
| Maternity Benefit | 21,279 | 18,184 ¶ | 85% | 37,681 | 177% | 20,209 ¶ | 95% | 37,964 | 178% | 16,000 | 75% | |
| Illness, Disability & Caring | Carer’s Allowance | 84,028 | 98,877 | 118% | 97,998 | 117% | 87,559 | 104% | 85,148 | 101% | n/a | n/a |
| Illness Benefit | 49,313 | 48,142 | 98% | 46,958 | 95% | 49,313 | 100% | 47,811 | 97% | 4,000 | 8% | |
| Invalidity Pension | 58,168 | 53,025 | 91% | 53,025 | 91% | 58,168 | 100% | 58,168 | 100% | 197,000 | 339% | |
| Disability Allowance | 146,755 | 178,104 | 121% | 166,664 | 114% | 146,755 | 100% | 136,431 | 93% | 157,000 | 107% | |
| Injury Benefit | 1,314 | § | § | § | § | § | § | § | § | 5,000 | 381% | |
| Child-related payments | Working Family Payment | 53,104 | 47,564 | 90% | 54,243 | 102% | 53,104 | 100% | 58,066 | 106% | 15,000 | 28% |
| Child Benefit | 637,007 | ** | 695,878 | 109% | ** | 675,319 | 106% | 688,000 | 108% | |||
-
*
Source 2019 SISWS file: https://www.gov.ie/en/publication/02f594-annual-sws-statistical-information-report/
-
†
Source: EUROMOD Country Report Ireland 2018-2021, Table 4.7. Recipient numbers are rounded to the nearest thousand.
-
‡
SISWS 2019 figures adjusted to exclude recipients living outside the state and those living in long-term residential care.
-
§
Statistics are disclosed due to small sample sizes to ensure adherence to CSO Statistical Disclosure Control rules.
-
¶
Lower statistical reliability due to a small number of unweighted observations.
-
**
Child benefit is reported at a child level in the SILC data but at a recipient (i.e. parental) level in SWITCH and in administrative data, so the SILC input observations are excluded due to non-comparability.
To examine the impact of the reweighting process, we compare the benefit recipient numbers simulated by SWITCH with the original and the revised weights to the official statistics. By design, as the reweighting method ensures that the administrative numbers used as targets/control totals are met exactly, our reweighting process results in the weighted number of recipients in the input data (column (4)) matching the administrative numbers. Examining the ratios to administrative statistics using the SWITCH output data (column (5)) again provides strong reassurance that the model is simulating benefit entitlements correctly as the ratio of recipients in the output data using the revised weight remain close to 100% for most schemes. Simulated Maternity Benefit numbers are higher than those actually reported in the input data and may reflect the fact that some people opt to have the benefit paid directly to their employer, therefore SWITCH simulates higher numbers of eligible individuals. Simulated Working Family Payment (WFP) recipient numbers are 15% higher than administrative estimates. SWITCH incorporates a take-up adjustment for WFP based on an estimated take-up rate of 33% (see Callan and Keane, 2008). The gap suggests that take-up may have changed since these estimates. Simulated numbers on Supplementary Welfare Allowance (SWA) are too low to report but this reflects the fact that some SWA recipients are individuals with little or no income who are awaiting the processing of a claim for a different social welfare benefit and may receive SWA as an emergency measure in the meantime. The SWITCH model assumes people receive benefits as soon as they are entitled to them, therefore processing delays are likely to explain this gap.
Remaining gaps tend to be small and more frequent in means tested (non-contributory) benefits such as the State Pension (non-contributory), Jobseeker’s Allowance and Disability Allowance. This may reflect improvements in some recipient’s financial situation as the SWITCH model assesses the person based on their current income/means – some recipients may have qualified for one of these payments at the point of application but may have experienced an improvement in their financial circumstances so that they are no longer eligible for the payment based on their current income levels. Alternatively, in the case of Jobseekers’ Allowance, for example, SWITCH may simulate the person in receipt as eligible for a different payment, such as the One-Parent Family payment (if they appear from the data to be a lone parent) or the Working Families payment (if they are only part-time unemployed).29 Lastly, as the administrative figures we use in the reweighting process do not contain those who pay no tax, we do not reweight the lowest band of the income distribution (€0-10,000). This is likely to result in an underestimation of the number of tax-units in this income band as SILC estimates a lower population of tax units in general. This has repercussions for the simulation of means-tested benefits in general, with estimates of such benefits likely to come in below administrative figures for receipt and amount.
Finally, we also compare benefit recipient numbers as simulated by the Irish component of EUROMOD to administrative statistics. Much larger discrepancies are found here – in fact only two schemes fall within 10% of administrative numbers. While the reweighting process used in SWITCH explains part of these discrepancies, the differences are much larger than when using SWITCH estimates and the original CSO Ireland weight. Therefore, these differences are also driven by input data and modelling issues. The use of the more detailed RMF data in the SWITCH model, as opposed to the UDB data in EUROMOD, results in significantly more precise eligibility simulation in SWITCH compared to EUROMOD. For example, the aggregation of benefits in the UDB makes it more difficult to identify precisely eligibility for benefits that use receipt in the input data to identify eligibility (i.e. part-simulated benefits). In addition, the UDB records the total amount received in benefits in the last year but not whether the benefit is currently being received. The DSP register data indicating current receipt of benefits (at a dis-aggregated level) present in the RMF thus allows SWITCH to identify exactly what benefit a person is currently receiving. The resulting part-simulated benefit recipient numbers are significantly more precise. The focus on current incomes in SWITCH, as opposed to annual incomes in EUROMOD, will also play a role in better identifying current entitlements to means-tested benefits.
In addition to examining benefit recipient numbers, we also compare how the SWITCH model performs in terms of annual benefits’ expenditure using the original and revised weight (Table 6). Doing so helps to highlight potential modelling errors, for example incorrect benefit payment rates in the model. It also allows us to examine if the model is representative not just of the total number of recipients of each benefit but also the distribution of people within benefits – for example if the model simulates a similar number of actual benefit recipient numbers but vastly over or underestimates the expenditure on a scheme it may suggest that the model simulates too many higher/lower rate recipients of, say, a means tested benefit. It is worth bearing in mind, however, that administrative statistics on the expenditure per scheme and SWITCH estimates may not be fully comparable due to a ‘stock’ versus ‘flow’ issue – the administrative recipient numbers show the ‘stock’ of recipients at a point in time (as at 31st of December 2019) rather than the total number of people (or ‘flow’) who received the benefit during the year. SWITCH numbers also show the ‘stock’ of people eligible for a benefit at the point of interview.30 While this may not match exactly the people eligible as at December 31st it is significantly more comparable than comparing to the flow of all recipients throughout the year, particularly for benefits that have shorter term receipt, such as Jobseeker’s or Maternity Benefit. Expenditure numbers, however, capture all expenditure on a benefit over the entire year while the SWITCH expenditure estimate is generally calculated by annualising (i.e. multiplying by 52) the weekly amount received by those unemployed and in receipt of one of these payments at the point of interview.31 Therefore, we would expect more divergence between SWITCH and administrative values for benefits that are received for a shorter period of time or that experience large month to month changes in recipient numbers.
Benefit Expenditure Comparison, 2019 (€, thousands)
| (1) | (2) | (3) | (4) | |||||
|---|---|---|---|---|---|---|---|---|
| Scheme type | Scheme Name | 2019 Admin Numbers* | SILC 2019 weight (output data) | SWITCH revised 2019 weight (output data) | EUROMOD 2019† | |||
| Expenditure | Ratio to 2019 Admin | Expenditure | Ratio to 2019 Admin | Expenditure | Ratio to 2019 Admin | |||
| Pensions | State Pension (Contributory)‡ | 5,603 | 4,959 | 89% | 5,052 | 90% | 9,137 | 163% |
| State Pension (Non-Contributory) | 1,043 | 1,021 | 98% | 994 | 95% | 894 | 86% | |
| Widow’s Pension (Contributory)‡ | 1559 | 1,685 | 108% | 1,489 | 96% | 356 | 23% | |
| Widow’s Pension (Non-Contributory) ‡ | 14 | § | § | § | § | 72 | 516% | |
| Working age income support | Supplementary Welfare Allowance | 120 | § | § | § | § | 1 | 1% |
| Jobseeker’s Allowance | 1,629 | 1,643 | 101% | 931 | 57% | 1,501 | 92% | |
| Jobseeker’s Benefit | 348 | 351 | 101% | 280 | 80% | 400 | 115% | |
| One Parent Family Payment | 533 | 497 | 93% | 485 | 91% | 1,329 | 249% | |
| Maternity Benefit | 267 | 174 | 65% | 163 | 61% | 113 | 42% | |
| Illness, Disability & Caring | Carer’s Allowance | 863 | 1,032 | 120% | 900 | 104% | n/a | n/a |
| Illness Benefit | 607 | 575 | 95% | 561 | 92% | 27 | 4% | |
| Invalidity Pension | 728 | 692 | 95% | 773 | 106% | 2,540 | 349% | |
| Disability Allowance | 1,706 | 1,957 | 115% | 1,530 | 90% | 1,799 | 105% | |
| Injury Benefit | 14 | § | § | § | § | 41 | 301% | |
| Child-related payments | Working Family Payment | 397 | 260 | 66% | 232 | 58% | 80 | 20% |
| Child Benefit | 2,103 | 2,067 | 98% | 1,992 | 95% | 2,034 | 97% | |
-
*
Source 2019 SISWS file: https://www.gov.ie/en/publication/02f594-annual-sws-statistical-information-report/
-
†
source: EUROMOD Country Report Ireland 2018-2021, Table 4.8.
-
‡
SISWS 2019 figures adjusted to exclude recipients living outside the state and those living in long-term residential care
-
§
Statistics are disclosed due to Secondary Disclosure Controls.
Examining the estimated expenditure of the benefits as simulated by SWITCH when applying the revised weights (column (3)), we see that the total expenditure estimated by SWITCH using the revised weight compares favourably to administrative statistics (column (1)) for the most part - capturing between 90% to -106% of the administrative numbers on all but four schemes. The costs for Jobseeker’s Allowance, Jobseeker’s Benefit, Maternity Benefit and Working Family Payment are underestimated (capturing 57% to 80% of their administrative cost) – in fact the expenditure numbers using the original weight (column (2)) for these four schemes are actually closer to the administrative total. Despite this, it is still more likely the case that the SWITCH estimates using the revised weight are more accurate in capturing total expenditure at a point in time, given the fact that simulated recipient numbers on these four schemes compare well to administrative statistics, as shown in Table 5. Instead, seasonal variations in unemployment and the stock/flow issue described above help explain the discrepancies between SWITCH and administrative expenditure numbers on Jobseekers Allowance and Benefit as receipt of these benefits tends to be short-term so that considerable turnover on these schemes will occur. Maternity Benefit is only payable for 26 weeks; therefore it is not surprising that the administrative figure (capturing total expenditure on the scheme for all recipients during the year) is double that of SWITCH (which is calculated by multiplying the weekly simulated entitlement of those eligible for Maternity Benefit at the point of interview by the 26 week entitlement).
Finally, we look at how non-cash benefit recipients (Medical Card and GP-Visit cardholders as well as beneficiaries of ECCE and NCS) are captured in SWITCH with the original and the revised weights compared to administrative data. These schemes do not compare as well to administrative numbers as cash benefits, using either the original CSO Ireland weights or the revised weight as shown in Table 7 – in fact the comparison to administrative numbers worsens once the revised weights are used. Possible reasons for these discrepancies are discussed below.
Non-Cash Benefits Comparison
| Non-cash Benefit | 2019 Admin Numbers | SILC 2019 weight (output data) | SWITCH revised 2019 weight (output data) | ||
|---|---|---|---|---|---|
| N | Ratio to 2019 Admin | N | Ratio to 2019 Admin | ||
| Medical Card | 1,544,374* | 1,389,272 | 90% | 1,004,881 | 65% |
| GP Visit Card | 524,494* | 573,932 | 109% | 659,999 | 126% |
| Early Childhood Care & Education Scheme | 118,896† | 71,656 | 60% | 75,635 | 64% |
| National Childcare Scheme | 62,686‡ | 154,926 | 247% | 5,441 | 264% |
-
*
-
†
source: data for 2017 from DCEDIY.
-
‡
source: administrative numbers for the monthly average participants between 2019-2020 from DCEDIY.
Regarding Medical and GP-Visit Cards there is evidence of substantial non-take-up of these cards, particularly for the latter, with Keane et al. (2021) estimating a non-take-up rate of Medical Cards of 31% and 90% for means-tested GP-Visit cards (Keane, 2018). Take-up of public healthcare entitlements amongst the eligible population is seldom universal in countries without universal healthcare coverage such as Ireland and the U.S. (Baicker et al., 2013). This issue can help explain why SWITCH estimates may differ substantially from administrative figures as the numbers shown are based on the numbers eligible (therefore assumed to be availing of the entitlement). The SWITCH model does have the option to specify a take-up rate for these cards and therefore model random non-take-up. Non-take-up helps explain why SWITCH overestimates entitlement to GP-Visit Cards.
The SWITCH estimate for Medical Cards is, however, lower than administrative figures. A number of reasons can help explain this. Some individuals hold a card who are not currently eligible based on their means. These can be categorised into three distinct groups. First, discretionary cards (i.e. cards awarded to those above the income limit) account for around 10% of administrative numbers (see Prior et al. (2019)) and these cannot be modelled by SWITCH as there is no identifiable criteria for a card on this basis.32 Second, card holders can retain their card for three years after returning to employment after a spell of long-term unemployment. SWITCH cannot model retained cards as longitudinal information on benefit receipt is not available in the SILC data. There is no administrative information relating to how many retained cards there are in the total figure. Third, cards are issued on a three-year basis – the obligation is on cardholders to report if their means have increased since the initial granting of the card but some may not do so and still hold the card despite an increase in income. Simulation of means for the purposes of the cards may also not be exact in the SWITCH model – while the underlying data in the model contains the vast majority of information needed to calculate an individual’s means for Medical and GP-Visit card purposes it does not contain information on travel to work costs which are allowed against income in the means calculation. Therefore, the model may overestimate means, and therefore underestimate the numbers entitled to the card. Robustness checks carried out which included in the model average travel to work costs for individuals did not, however, significantly impact the numbers modelled as eligible for the cards (see Keane et al., 2021).
ECCE beneficiaries are underrepresented with both weights, accounting for 60% and 64% of the administrative data when the original CSO Ireland and the revised weights are respectively applied whereas the beneficiaries of NCS are overrepresented - accounting for 247% and 264% of the administrative data beneficiaries respectively. ECCE eligibility is based on age (children must be between 2 years 8 months and 5 years, 6 months old and not in primary school) and the input data (applying the revised weight) compares favourably to administrative population statistics overall matching nearly exactly the total number of 2-5 year olds in the population. However, simulation of ECCE entitlement is also linked to reported childcare use with the subsidy only awarded to those who signal that their child in in a childcare setting for at least 15 hours a week (the pre-school entitlement). This reporting of childcare usage may be somewhat inaccurate as it is framed as “usual hours” per week of childcare. The ECCE scheme is only provided for 38 weeks of the year with a break over the summer months. Parents interviewed during the summer months may, therefore, report zero hours (and therefore the model will not simulate them as availing of the ECCE scheme) even if their child attends pre-school during the academic year.
Regarding the NCS scheme, a number of reasons may account for the difference in the number of beneficiaries. Firstly, the NCS was only introduced in 2019, with a number of legacy schemes operating in parallel for the first year. Entitlement to these legacy schemes is complicated and not possible to simulate as the SILC data does not contain all the eligibility information needed, therefore it is not possible to identify how many people may be eligible for the NCS but remain under the old legacy scheme. The available administrative data for the first year of the scheme rollout may, therefore, not be capturing fully the number of NCS beneficiaries as people take time to transition to the new scheme. Possible take-up issues might also arise from the fact that this was the first year that the scheme was operational and thus people eligible may not have been aware of its existence or that they were eligible for a subsidy. Another possible reason could be the way that participation in the scheme is captured in SWITCH. Administrative data captures the average number of beneficiaries throughout the year, accounting for potential lower participation in the scheme during summer. In SWITCH, we assume that the weekly hours of participation (based on the reported ‘usual’ weekly hours used of formal childcare at the date of interview) are the same throughout the year, which is likely to overestimate average participation.
While larger discrepancies occur between the non-cash benefits modelled in SWITCH compared to administrative statistics it is important to bear in mind the more limited impact of this than if large discrepancies occurred between SWITCH and administrative numbers on cash benefits. As these are non-cash benefits, no monetary value is generally placed on them, so these discrepancies have no impact on the estimated (cash) income of a household and therefore any model results estimating distributional impacts, poverty and inequality rates. The main advantage of simulating eligibility for these schemes is to allow policymakers and government users of the model to estimate the impact of changes to tax-benefit rules or to parameters of these schemes, such as the means test on the numbers eligible for them. It is also likely that comparisons to administrative numbers may improve over time – for example if the take-up rates of Medical or GP-Visit cards improves and as the NCS becomes more established.
5. Conclusions
The SWITCH model has been used by researchers and policy makers to simulate the effect of policy changes in Ireland for three decades. Recently, the model was updated by harmonising the modelling platform, modelling language and simulation engine with that of EUROMOD, the European Union’s microsimulation model.
While the model runs on the EUROMOD platform, SWITCH presents some advantages compared to the Irish component of EUROMOD. First, it is linked to more detailed register data which is reweighted to better represent the reference year population. This also allows the simulation of extra policies, such as non-cash benefits. Second, SWITCH is updated in a more timely manner than EUROMOD, in line with the Irish budgetary cycle. The more up to date nature of SWITCH is essential due to the fact that the model is provided to users across a variety of government departments and allows results from the model to feed into the annual Budget process, for example by allowing the analysis of the cost and distributional impact of tax-benefit changes to take place before the changes are actually implemented. The harmonisation of SWITCH with the European microsimulation model also presents an opportunity for researchers by facilitating cross-country research.
This paper provides information on how the input data for the SWITCH model is prepared and verified. It also details why, and how, reweighting of the input data is carried out and how the data is adjusted to be representative of the current population through the use of uprating. A description of how the impact of the COVID pandemic labour market shock is implemented is also provided.
The model is extensively validated against external administrative sources. The reweighting process helps ensure that the underlying data in the model represents to a much greater extent the labour force, income distribution and cash benefit recipiency population which greatly improves the accuracy of the model and provides users with additional faith in results from the model. While discrepancies occur between model estimates of entitlements to in-kind benefits the fact that such benefits do not carry a monetary value means that such discrepancies have no impact on the main results of the model as they are based on cash incomes. Some comparability issues with administrative statistics for these non-cash benefits have also been highlighted and help explain why such discrepancies exist.
Footnotes
1.
Specifically, those in the Departments funding the ESRI’s Tax, Welfare and Pensions Research Programme.
2.
The EUROMOD 2019 input data for 10 countries (AT, BE, BG, CZ, ES, FR, HR, HU, MT, NL) is based on the EUROMOD SILC database (EMSD) generated by Eurostat. The extension to the remaining countries expected for the coming years. The EMSD includes all UDB (User Database) variables, as well as national SILC data supplied by National Statistical Institutes and EUROMOD variables created and imputed by Eurostat because of restricted data access or in-house knowledge. For more information on the EUROMOD model and project see https://euromod-web.jrc.ec.europa.eu/overview/what-is-euromod and Sutherland and Figari (2013).
3.
See https://euromod-web.jrc.ec.europa.eu/overview/country-by-country/detail?id=11 for more detail.
4.
5.
6.
The Revenue Commissioners, often referred to as ‘Revenue’ is the Irish Government agency responsible for customs, excise, and taxation.
7.
Currently, 96 percent of employee income information comes from administrative data. The CSO revert to data collected from the questionnaire for cases that cannot be matched to administrative data.
8.
This distinction is important as Jobseekers Benefit is not means tested, therefore the full rate of the payment will be received by the individual regardless of other income/their partners income while Jobseekers Assistance is means tested and therefore will be reduced, or not received at all, depending on other/partner’s income.
9.
E.g. a property value worth €100m or a pension receipt coded as 999,999,999. Values such as 99,999 or 999,999,999 are used by the CSO Ireland to indicate a missing value.
10.
The majority of households provide an estimate for the value of their property which can then be used to identify property tax liability – for those without estimates the property can be valued in a number of ways – either by applying a premium to the insured value of the property (as insured values are generally lower as they exclude the land value) or using results from a hedonic regression run on those who do provide a property value – basically the characteristics of the property and its location allow us estimate a property value.
11.
For instance, imputing current education involves combining information on age, hours of preschool attendance, and current education activity. If an individual is under 6 years old and has 0 hours of preschool attendance, we can categorise that individual as “not in education”. Similarly, if a child is under 13 and is not yet in education nor in pre-school, they are categorised as a primary school student, or lower secondary if they are between 13 and 16. Individuals aged 18 or under whose current education activity is “in education” are categorised as upper secondary.
12.
13.
14.
The description of CSO’s weighting process is a summary of the Background Notes Of CSO’s Survey on Income and Living Conditions (SILC) 2019 found at https://www.cso.ie/en/releasesandpublications/ep/p-silc/surveyonincomeandlivingconditionssilc2019/backgroundnotes/.
15.
No up-to-date administrative numbers of employed/unemployed persons are available for 2019 as the latest Census data covers 2016.
16.
The LFS is carried out quarterly, we take the average employment/unemployment numbers for all four quarters of 2019 for use in the reweighting process.
17.
The benefits for which we calibrated recipient numbers are: State Pension (Contributory and Non-Contributory), Widow’s pensions (Contributory and Non-Contributory), Jobseeker’s Benefit, Jobseeker’s Allowance, Illness Benefit, Disability Allowance, One-Parent Family Payment, Working Families Payment and Supplementary Welfare Allowance. The weight is calculated based on receipt of these benefits in the underlying SILC data. Some are not controlled for as the original weight already did a good job at matching administrative information or as doing so results in the STATA reweighting process failing to converge (this was the case mainly for smaller schemes as very few unweighted observations existed in the survey data).
18.
The forecasted income distribution was created by applying the average annual change for years 2015 to 2018 to each income band to the 2018 income distribution.
19.
As the last Census available is from 2016, ‘projected Census’ figures are provided by the CSO based on Census 2016 figures and incorporating assumptions around fertility, mortality, and migration. It is these projected figures (for 2019) that are used in our reweighting and validation process.
20.
An additional STATA based model, developed jointly with the Department of Finance, based on the Household Budget Survey -ITsim- estimates the indirect taxes (VAT and excise duties, including carbon taxes) paid by Irish households on the basis of their reported expenditure, collected by the CSO’s nationally representative Household Budget Survey (HBS). ITSIM has been used in conjunction with SWITCH in order to examine the distributional impacts of direct tax and welfare and indirect tax changes.
21.
A small proportion of Medical Card recipients are granted a card on a discretionary basis i.e. their means are above the relevant limit but they have certain medical needs that would place ‘undue hardship’ on them financially in the absence of the card. As such cards are granted on a discretionary basis with no particular rule on how they are granted it is not possible to simulate entitlement to these cards.
22.
Work is currently underway to incorporate the calculation of financial incentives to work in the model.
23.
Income is equivalised in the model to take account of the fact that needs of a household or family grow as the household gets larger but economies of scale in consumption mean that they do not increase in a proportional fashion for example, housing or heating costs do not increase two or threefold as a household grows from 1 to 2 to 3 people. We use the CSO equivalence scale to calculate equivalised household size. The national scale attributes a weight of 1 to the first adult, 0.66 to each subsequent adult (aged 14+ living in the household), and 0.33 to each child aged less than 14.
24.
ESRI researchers, who develop and maintain the SWITCH model, can generate additional outputs for model development purposes – for example to check the feasibility of such outputs. Additional outputs can then be added to the SWITCH results file (with the appropriate SDC rules put in place) for external users.
25.
The RMFs do not contain any direct identifiers but a risk of disclosure may occur due to indirect information.
26.
Married couples are generally counted as one tax unit.
27.
For the simulation we use the benefit rules in place in 2019 to match the data year.
28.
The numbers shown by SILC/SWITCH will not always be directly comparable to the information provided in the Social Welfare Statistical Report as the SILC/SWITCH figures provided will capture the (weighted) number of recipients at the point of interview while the administrative numbers tend to capture the recipient numbers as at 31/12/2019.
29.
Jobseekers supports are available, not just to those fully unemployed, but also to those who are unemployed for 4 in 7 consecutive days. If, however, an individual works part-time but spread over four or more days, they are not entitled to part-time unemployment supports. We are unable to distinguish between these two states of unemployment using SILC data.
30.
Interviews occur throughout the calendar year.
31.
As Maternity benefit has a maximum duration of 26 weeks this benefit is annualised by multiplying the current amount an individual receives by 26 weeks.
32.
Rather individuals must provide a letter from their GP outlining the medical need for a card and provide information on expenditures on health related items.
Appendix
Box 1. EUROMOD/SWITCH comparison
While SWITCH uses the EUROMOD platform the two models can be seen as two distinct entities. The main differences are briefly summarised below:
Different datasets: The EUROMOD model is based on the SILC UDB while SWITCH is based on the SILC RMF. Modelling of benefits is therefore more precise in SWITCH as more detail is present in the RMF and information on the exact benefit (currently) received is present while benefits are aggregated in the UDB with no information on current receipt.
Additional policies: Due to the more detailed nature of the RMF, additional policies are modelled in SWITCH compared to EUROMOD such as non-cash-benefits e.g. entitlement to Medical and GP cards (plus the ability to include values of such benefits) and childcare subsidy entitlement.
Annual v current focus: The SWITCH model focusses on current employment income and current benefit entitlement while the EUROMOD model focuses on annual incomes with the previous year providing the reference period. SWITCH, therefore, is more precise in calculating means for means-tested benefits as these are generally based on current income.
Reweighting: The EUROMOD model uses the original weight constructed by the CSO while the SWITCH model reweights the data to ensure it is representative, not just on demographic grounds, but also in terms of employment status, income levels and benefit recipiency. This results in a more accurate depiction of the income distribution (with knock on effects for estimates for income taxes etc.) and benefit recipient population.
Results file: Both models provide (slightly different) detailed, standardised excel results file. SWITCH provides some extra results such as the gender impact of policy changes. In SWITCH, CSO SDC rules are implemented in the results file which ensures any results based on small sample sizes are not displayed. This ensures timely access to results as the file does not have to be cleared by a CSO statistician. It also removes the risk of a user inadvertently breaching SDC rules.
References
-
1
The impact of COVID-19 on households´ income in the EUJournal of Economic Inequality 19:413–431.https://doi.org/10.1007/s10888-021-09485-8
-
2
The Oregon experiment--effects of Medicaid on clinical outcomesNew England Journal of Medicine 368:1713–1722.https://doi.org/10.1056/NEJMsa1212321
-
3
Analysing the effects of tax-benefit reforms on income distribution: a decomposition approachThe Journal of Economic Inequality 8:1–21.https://doi.org/10.1007/s10888-008-9101-4
-
4
Changes in income distributions and the role of Tax-Benefit policy during the great recession: an international perspectiveFiscal Studies 38:559–585.https://doi.org/10.1111/1475-5890.12113
-
5
Research in Labor Economics (Research in Labor Economics)307–339, In-Work Transfers in Good Times and Bad: Simulations for Ireland, In:, Research in Labor Economics (Research in Labor Economics), Vol, 33, Emerald Group Publishing Limited, pp.
-
6
Le modèle de microsimulation TAXIPP – version 1.0, guide Methodologique IPP, Septemberr 20191–52.
- 7
- 8
- 9
-
10
Ireland’s economic adjustment: from crisis to recoveryInter Economics 49:300–322.https://doi.org/10.1007/s10272-014-0514-y
-
11
Crisis, response and distributional impact: the case of IrelandIZA Journal of European Labor Studies 3:9.https://doi.org/10.1186/2193-9012-3-9
-
12
The impact of comparable policies in European countries: Microsimulation approachesEuropean Economic Review 41:627–633.https://doi.org/10.1016/S0014-2921(97)00006-8
- 13
-
14
The unequal inequality impact of the COVID-19 pandemic (no.2021/06)Bruegel Working Paper.
- 15
- 16
-
17
Calibration estimators in survey samplingJournal of the American Statistical Association 87:376–382.https://doi.org/10.1080/01621459.1992.10475217
-
18
Demographic change and the European income distributionThe Journal of Economic Inequality 17:337–357.https://doi.org/10.1007/s10888-019-09411-z
-
19
Automatic stabilizers and economic crisis: US vsEurope," Journal of Public Economics, Elsevier 96:279–294.
-
20
What drove income inequality in EU crisis countries during the Great Recession, 42Fiscal Studies.https://doi.org/10.1111/1475-5890.12250
-
21
Role of Distributional impact assessmentPresentation to Conference on Addressing Economic Inequalities organised by the European Commission.
-
22
Estimating the anti-poverty effects of changes in taxes and benefits with the TRIM3 microsimulation modelWashington, DC: Urban Institute.
-
23
Supporting low income working families: Enabling resiliences.l: MUSSI Working Paper Series.
-
24
Can Parents Afford to Work? Childcare Costs, Tax-Benefit Policies and Work Incentives, IZA Discussion Papers, No.1932Bonn: Institute for the Study of Labor (IZA).
-
25
Trends in income inequality, pro-poor income growth, and income mobilityOxford Economic Papers 58:531–548.https://doi.org/10.1093/oep/gpl014
- 26
-
27
Irish public finances through the financial crisisFiscal Studies 36:475–497.https://doi.org/10.1111/j.1475-5890.2015.12077
-
28
The Take-up of medical and GP-Visit cards in IrelandPowerpoint presentation, https://www.youtube.com/watch?v=NXR6q8WbYdw, Accessed, January 2022.
-
29
Failure to take-up public healthcare entitlements: evidence from the medical card system in IrelandSocial Science & Medicine 281:114069.https://doi.org/10.1016/j.socscimed.2021.114069
-
30
European Economy - Economic Briefs 028, Directorate General Economic and Financial Affairs (DG ECFIN), European CommissionPersonal Income Tax in Ireland: The Future of the Universal Social Charge, In:, European Economy - Economic Briefs 028, Directorate General Economic and Financial Affairs (DG ECFIN), European Commission.
-
31
Modelling the Distributional impact of the COVID-19 crisisFiscal Studies 41:321–336.https://doi.org/10.1111/1475-5890.12231
-
32
Sreweight: a Stata command to Reweight survey data to external TotalsThe Stata Journal: Promoting communications on statistics and Stata 14:4–21.https://doi.org/10.1177/1536867X1401400103
-
33
Indexing out of poverty? fiscal drag and benefit erosion in Cross‐National perspectiveReview of Income and Wealth 66:311–333.https://doi.org/10.1111/roiw.12413
-
34
EUROMOD Working Papers EM9/17, EUROMOD at the Institute for Social and Economic ResearchDecomposition of changes in the EU income distribution in 2007-2011, In:, EUROMOD Working Papers EM9/17, EUROMOD at the Institute for Social and Economic Research.
- 35
-
36
Accounting for differences in income inequality across countries: tax-benefit policy, labour market structure, returns and demographicsThe Journal of Economic Inequality 19:13–43.https://doi.org/10.1007/s10888-020-09454-7
-
37
EUROMOD: the European Union tax-benefit microsimulation modelInternational Journal of Microsimulation pp. 1–24.
-
38
Technical Paper on the Measurement of Household Joblessness in SILC and QNHS, 2004-2012: An Analysis of the Central Statistics Office (CSO) Survey of Income and Living Conditions (SILC) and the Quarterly National Household Survey (QNHSTechnical Paper on the Measurement of Household Joblessness in SILC and QNHS, 2004-2012: An Analysis of the Central Statistics Office (CSO) Survey of Income and Living Conditions (SILC) and the Quarterly National Household Survey (QNHS, Social Inclusion Technical Paper no.6, Dublin, Department of Social Protection.
Article and author information
Author details
Funding
Funding from the ESRI’s Tax, Welfare and Pensions Research Programme (supported by the Departments of Public Expenditure and Reform, Employment Affairs and Social Protection, Health, Children and Youth Affairs and Finance) is gratefully acknowledged.
Acknowledgements
We are grateful to the CSO for facilitating access to the Survey of Income and Living Conditions (SILC) Research Microdata File used to construct the database for the SWITCH tax-benefit model. SWITCH is based on the EUROMOD platform. Originally maintained, developed and managed by the Institute for Social and Economic Research (ISER), since 2021 EUROMOD is maintained, developed and managed by the Joint Research Centre (JRC) of the European Commission, in collaboration with EUROSTAT and national teams from the EU countries. We are indebted to the many people who have contributed to the development of EUROMOD.
Publication history
- Version of Record published: April 30, 2023 (version 1)
Copyright
© 2023, Keane et al.
This article is distributed under the terms of the Creative Commons Attribution License, which permits unrestricted use and redistribution provided that the original author and source are credited.