Simulations of Policy Responses and Interventions to Promote Inclusive Adaptation to and Recovery from the COVID-19 Crisis in Ecuador
Abstract
COVID-19 has had a devastating effect on the economy and the health of households around the world. In this study, we evaluate the economic impact of COVID-19, as well as the effect of government interventions aimed at alleviating it, on the welfare of Ecuadorian households in terms of income shocks, poverty rates, and inequality. The empirical strategy used is to measure mean income shock by gender and economic sector based on cross-sectional data from December 2019, May 2020, and September 2020, and use these estimates to simulate individual income shocks from the December 2019 data. This allows us to disaggregate our analysis by demographic and employment profile in order to identify groups at risk and help guide future government COVID recovery programs. We find that by May 2019, poverty had more than doubled, reaching 57%, and average income had fallen by more than 50%. Informal workers, rural populations, indigenous households, and households with young kids were among those most affected. Government interventions thus far have had a negligible effect in the aggregate, but they may have been crucial for the subsistence of households below the poverty line.
1. Introduction
The sudden appearance and rapid spread of the COVID-19 virus pushed governments around the world to partially shut down their economies in order to limit contact and suppress transmission. During the first trimester of the pandemic, Ecuador was among the countries hardest hit by the virus. Even though it was one of the first countries to impose lockdown measures, according to an analysis of mortality data by The New York Times, the overall number of deaths in Ecuador between March and October 2020 was 36,800 higher than in the same period in previous years – that is 2.97 times higher than the number of deaths officially reported.
The economic effects of the pandemic are widely felt in the country, which was also dealing with one of its worst economic crises in decades at the time of the virus outbreak. Most Ecuadorian households are economically vulnerable to income shocks, and COVID-19’s dual impact on both supply and demand has exacerbated this vulnerability. The social distancing and lockdown measures needed to reduce the spread of the virus have had important consequences for the labour market and private transfers, and thus directly affected households’ economic well-being. In addition, a large share of workers are informal workers (they accounted for 66% of total employment in December 2019).1,2 Economic shocks to employment and labour income are particularly dangerous for these workers as they have very limited savings capacity and do not have access to unemployment protection.
So far, the Ecuadorian government has implemented two large-scale policy responses to alleviate the economic impact of the crisis on household welfare:3
The Humanitarian Support Law, which introduces minor tax relief measures and labour reforms along with other minor amendments to renegotiate commercial debt.4 In terms of labour reforms, it allows for the modification of existing economic conditions in current labour contracts, in particular, the reduction of employees’ working time up to 50 per cent of normal working hours, and thus a reduction in payments. In terms of social security coverage and unemployment protection, it allows salaried workers who have been laid off to apply for unemployment insurance after 10 rather than 60 days of unemployment, which was the previous eligibility requirement. The government increased its unemployment insurance expenditure by $372 million.5
The Family Protection Bond for Emergencies, which is a temporary emergency program targeting families whose income is below the minimum wage and who do not have access to social security (informal workers). The government spent $250 million on this program.
Yet, these policies seem quite modest compared to the economic impact of COVID-19. It is therefore key to evaluate the impact of COVID-19 on Ecuadorians’ economic well-being and the effectiveness of current policies. These evaluations must consider differences across key demographic and employment profiles, including gender, age, ethnicity, education, rural/urban area, formal/informal worker status, income decile, and firm size, to identify vulnerable groups and help policymakers shape future efforts to alleviate the economic impact of COVID-19.
This project is divided into three parts. First, we use cross-sectional data from household labour surveys to estimate COVID-19s impact on labour income by gender and economic sector from December 2019 to May 2020 and September 2020, as well as its overall impact on non-labour income. Then, we use these estimates to simulate individual income and household per capita income post-COVID-19. We analyse COVIDs average impact on income and poverty rates among key subpopulations, as well as its overall effect on inequality. Finally, we run simulations of the effect of existing alleviation policies.
The remainder of this paper is organised as follows: Section 2 presents Ecuador’s economic context pre-COVID; in Section 3, we discuss related studies; Section 4 describes the data and the empirical strategy used; Section 5 presents our results; and Section 6 concludes this paper.
2. Ecuador’s economic context
Ecuador already had a fragile economy when it became one of the countries most affected by COVID-19. Since 2015, its average economic (GDP) growth has been almost zero and its per capita GDP has decreased every year, except in 2017 when it grew marginally (see Table 1). Unemployment fell from 4.7% to 3.8% in 2019, but this was because of lower participation in the labour market and an increase in informal work from 58.4% to 66.07%. Part of this growth in informality is driven by growth in self-employment, from 34% to 38%. This increase is likely to be attributable to workers who could not find salaried work starting low productivity subsistence activities. Labour income also fell, and fiscal accounting deteriorated. The country also has high levels of income inequality (its Gini coefficient was 0.459 in 2017, 0.469 in 2018, and 0.473 in 2019). Furthermore, the incidence of poverty is high and trending upward (21.5% in 2017, 23.2% in 2018, and 25% in 2019).
Macroeconomic Statistics
| Indicator | 2015 | 2016 | 2017 | 2018 | 2019 |
|---|---|---|---|---|---|
| GDP (real 2007 $) | 70,174 | 69,314 | 70,955 | 71,870 | 71,909 |
| GDP growth (% annual) | 0.1% | -1.23% | 2.37% | 1.29% | 0.05% |
| Per capita GDP (real 2007 $) | 4,310 | 4,193 | 4,229 | 4,221 | 4,164 |
| Per capita GDP growth (% annual) | -1.45% | -2.72% | 0.85% | -0.18% | -1.36% |
| Public debt (% GDP) | 33% | 38.2% | 44.6% | 45.2% | 44.9% |
| Primary fiscal deficit (% GDP) | -1.68% | -5.34% | -5.39% | -2.46% | -2.48% |
| Total population | 16,278,844 | 16,528,730 | 16,776,977 | 17,023,408 | 17,267,986 |
| Working age population | 11,399,276 | 11,696,131 | 11,937,928 | 12,239,023 | 12,402,565 |
| Active population | 7,498,528 | 7,874,021 | 8,086,048 | 8,027,130 | 8,099,030 |
| Activity rate (% labour force) | 65.78% | 67.32% | 67.73% | 65.59% | 65.3% |
| Unemployment rate (% labour force) | 4.77% | 5.21% | 4.62% | 3.69% | 3.84% |
| Informal work (% employed)* | 58.4% | 62.2% | 63% | 64.7% | 66.08% |
| Self-employed (% employed)* | 34.1% | 35.9% | 35.6% | 36.9% | 38.5% |
| Real mean monthly labour income† | 355.6 | 337.1 | 341.2 | 333.5 | 325.8 |
-
Source: Central Bank of Ecuador.
-
*
SEDLAC estimates.
-
†
$ USD.
For the vast majority of households in the country, labour income accounts for the main, if not the only, source of income. In December 2019, labour income accounted for 82% of total household income. Other sources of income include conditional cash transfers (CCT) from the government (CCT accounted for 15% of eligible households’ total income) and private transfers. In terms of social security coverage, only 53.9%of wage workers, or 24.7% of the working population, were registered with the system’s contributory scheme in 2019. If we take into account unpaid workers (16%) and self-employed individuals (38%), on average 75% of the working population was not covered by the social security system in 2019. Given that these workers have limited savings capacity to cope with economic shocks and do not have access to unemployment protection, changes in labour income that affect this group of workers are particularly important for economic policy.
3. Related literature
Several recent studies have focused on evaluating COVID-19’s impact on the world economy. For instance, the ILO (2021) estimated that the COVID pandemic resulted in 114 million lost jobs worldwide in 2020 compared to in 2019. Bottan et al. (2020) found from online surveys conducted in 17 countries in Latin America and the Caribbean that 45% of respondents reported that a household member had lost their job and 58% of respondents from business-owning families reported that a household member had closed their business. More strikingly, they found that, among respondents whose pre-COVID household income was below their national minimum wage, 71% reported that a household member had lost their job and 61% reported that a household member had closed their business. The authors show that the crisis due to the pandemic has exacerbated economic inequality.
At the macro level, Barro et al. (2020) used data from the great influenza pandemic of 1918-1920 to provide upper bounds for COVID-19 outcomes for a set of 48 countries. The authors predict a major global economic contraction of about 6 per cent for GDP and 8 per cent for consumption in a typical country. Sumner et al. (2020) investigated three different scenarios for economic contractions due to COVID-19 and their impact on poverty headcounts using international poverty lines. The authors estimate that in the most extreme scenario, i.e., 20 per cent contraction of income or consumption, the number of people living in poverty could potentially increase by 420–580 million relative to 2018.
Regarding Ecuador in particular, Jara et al. (2021) used a microsimulation model to study the role of tax-benefit policies in mitigating the immediate impact of the economic shock. They found that the policies do little to mitigate losses in household income due to COVID-19. They also report – in line with our findings – that inequality increased and poverty more than doubled. Yet, their study considers aggregate measures. In contrast, this paper analyses how COVID has impacted subgroups such as different demographic groups and types of workers. This is important as there are large differences in the level of vulnerability of different groups.
For instance, gender and ethnic disparities in Latin American and Caribbean (LAC) countries are well documented, and Ecuador is no exception. Canelas and Salazar (2014) used household surveys from Bolivia, Ecuador, and Guatemala to show that women are highly discriminated against in the labour market and undertake most domestic household activities in those three countries. Atal et al. (2009) used data from eighteen Latin American countries and found that in most of them, women are more likely than men to hold low-paid occupations and gender earning gaps remain substantial. Cunningham and Jacobsen (2008) analysed data on Bolivia, Brazil, Guatemala, and Guyana, and used simulations to show that there is significant income inequality across genders and ethnic groups in these countries.
4. Data and empirical strategy
4.1. Data
The data used in this paper is drawn from the 2019 and 2020 editions of the National Survey of Employment and Unemployment conducted by the Ecuadorian National Institute of Statistics (INEC).6 The ENEMDU is a nationally representative cross-sectional survey that collects detailed information on household demographics, occupations and labour force participation, housing and asset ownership, and labour and non-labour income. Examples of non-labour income are contributions from social assistance and private transfers.
The data also allows us to identify formal workers who are registered with the national social security system. Workers who are registered with the public contributory pension scheme have access to health care services and unemployment and retirement benefits. They also have the right to earn at least minimum wage, be paid for overtime and receive mandated benefits such as a Christmas bonus and profit sharing at the end of the fiscal year (Canelas, 2014; Canelas, 2019). In contrast, informal workers do not have any social security coverage.
4.2. Empirical strategy
The aim is to estimate individual income post-COVID and use it to analyse changes for key demographic groups.7 We start by computing the actual change in average income for each economic sector in May 2020 and September 2020 (the two post-COVID cross-sectional data sets) with respect to December 2019 (the last pre-COVID cross-sectional data set) (see Table 2). To do so, we compute mean labour income, , and total employment, , by gender, , and economic sector, , for each cross-sectional period, . We then compute the change in labour income, , at time (May 2020 and September 2020) with respect to December 2019 pre-COVID levels, , while considering the change in total employment in a given sector as zero-income to determine expected post-COVID income accounting for the probability of unemployment in each sector.8
We also compute the change in mean individual non-labour income, , again, accounting for zeros. Non-labour income includes remittances, government transfers, and private transfers.9
We use these shocks to estimate an individual’s expected post-COVID income, , based an their gender and economic sector and the projected change in individual non-labour income:
We then use these individual-level estimates to compute the change in total household per capita income, as well as household per capita labour and non-labour income. We use household per capita income to compute poverty rates (percentage of individuals with per capita household income below the official poverty line of $84.81) and inequality.
Finally, we simulate the impact of current government cash transfers in response to the crisis and additional unemployment insurance expenditures. Our strategy to evaluate the Family Protection Bond for Emergencies consists of considering the government’s total transfer expenditure ($250 million) and distribute it evenly to the simulated post-COVID incomes of the individuals who qualify – those who are below the extreme poverty line. To simulate the effect of the additional unemployment coverage, we consider the government’s total additional expenditure on unemployment ($372 million) and distribute it equally among formal workers.10,11
The advantage of this exercise is that we can then analyse income shocks and poverty rates for key demographic and employment profiles.
5. Evaluation of the impact of COVID-19
We start by reporting the empirical impact of COVID-19 on mean labour income and employment by gender and economic sector (see Table 2). In May 2020, aggregate mean income was down 51% compared to December 2019, and employment, 21%. Among females, the economic sectors that were most affected during this period were restaurants/hotels, personal services, and real estate, with drops in average income of 80%, 72%, 62%, respectively. Among males, the most affected sectors were construction, restaurants/hotels, and personal services, with drops in average income of 86%, 71%, 67%, respectively. By September 2020, the change in mean income across sectors had improved (-12% compared with December 2019) and average income had recovered in several sectors such as education, health, and services.
Empirical change in labour income and employment in 2019/2020 by gender and economic sector
| Economic sector | Mean income among employed | %Δ employment | Expected %Δ mean income | ||||
|---|---|---|---|---|---|---|---|
| 12/2019 | 06/2020 | 09/2020 | 12/19 - 6/20 | 12/19 - 9/20 | 12/19 - 6/20 | 12/19 - 9/20 | |
| Female | |||||||
| Agriculture + fishing + mining | 77.86 | 49.65 | 77.35 | -26.46% | -8.49% | -53.11% | -9.10% |
| Industry + electricity, gas & water | 324.77 | 221.35 | 278.52 | -25.38% | -18.28% | -49.14% | -29.92% |
| Construction | 422.16 | 432.41 | 426.62 | -16.96% | -5.66% | -14.94% | -4.66% |
| Trade | 277.39 | 165.63 | 236.39 | -27.92% | 1.39% | -56.96% | -13.59% |
| Restaurants & hotels | 305.56 | 76.37 | 215.01 | -20.97% | -9.98% | -80.25% | -36.66% |
| Transportation & communication | 579.35 | 423.97 | 408.56 | -20.00% | 12.19% | -41.46% | -20.88% |
| Real estate | 408.75 | 297.41 | 398.92 | -48.04% | -1.04% | -62.20% | -3.42% |
| Public administration and defence | 1008.34 | 828.78 | 970.17 | 12.01% | 37.44% | -7.94% | 32.24% |
| Education | 766.74 | 702.07 | 717.59 | -13.69% | -0.07% | -20.97% | -6.48% |
| Health | 736.98 | 677.06 | 864.37 | -17.13% | -4.89% | -23.87% | 11.56% |
| Personal services | 300.79 | 151.94 | 278.81 | -44.36% | -33.24% | -71.89% | -38.12% |
| Other services | 882.85 | 851.41 | 890.39 | 28.84% | 30.29% | -16.15% | 31.41% |
| All female | 309.97 | 227.62 | 295.71 | -26.42% | -7.36% | -45.97% | -11.62% |
| Male | |||||||
| Agriculture + fishing + mining | 241.79 | 146.09 | 211.96 | -12.89% | -7.57% | -47.37% | -18.97% |
| Industry + electricity, gas & water | 521.88 | 315.27 | 438.02 | -30.51% | -3.19% | -58.02% | -18.75% |
| Construction | 425.92 | 100.86 | 356.34 | -42.16% | -11.64% | -86.30% | -26.07% |
| Trade | 451.57 | 228.04 | 525.78 | -17.90% | -2.71% | -58.54% | 13.28% |
| Restaurants & hotels | 414.94 | 145.06 | 274.95 | -17.63% | 5.02% | -71.20% | -30.41% |
| Transportation & communication | 494.78 | 211.28 | 408.98 | -21.47% | -19.50% | -66.47% | -33.46% |
| Real estate | 619.63 | 338.42 | 520.18 | -24.85% | -10.52% | -58.96% | -24.88% |
| Public administration and defence | 1016.79 | 925.27 | 1067.36 | -11.51% | -9.65% | -19.48% | -5.16% |
| Education | 819.99 | 695.47 | 926.78 | -12.55% | 11.28% | -25.83% | 25.77% |
| Health | 956.67 | 885.62 | 919.35 | -8.14% | 1.57% | -14.96% | -2.40% |
| Personal services | 459.19 | 198.90 | 388.30 | -23.87% | -16.23% | -67.02% | -29.16% |
| Other services | 975.77 | 717.17 | 1017.63 | 18.44% | 10.97% | -12.95% | 15.73% |
| All male | 437.45 | 251.64 | 410.99 | -19.96% | -7.02% | -53.96% | -12.64% |
| All | 384.41 | 242.08 | 363.17 | -22.65% | -7.16% | -51.29% | -12.29% |
-
Source: ENEMDU December 2019, May/June 2020, and September 2020.
-
Note: The last two columns take into account the change in employment as zero-income.
-
Note: Income in USD.
There are gender differences in change in employment. In May 2020, female employment was down 26%, while male employment had dropped 20%. By September 2020, the change in employment across genders and sectors had improved, although it remained 7% lower than in December 2019 for both male and female workers.
Individual non-labour income had dropped 13% in May 2020 – despite a 34% increase in government transfers, albeit, from a very low base – but had returned to its pre-COVID level by September 2020 (see Table 3).
Empirical change in non-labour income in 2019/2020
| Income | Change | ||||
|---|---|---|---|---|---|
| Dec. 2019 | May 2020 | Sept. 2020 | % Δ Dec.-May | % Δ Dec.-Sept. | |
| Non-labour income | 44.34 | 38.37 | 44.30 | -13.46% | -0.09% |
| Government transfers | 4.44 | 5.94 | 4.80 | 33.75% | 8.06% |
-
Source: ENEMDU December 2019, May and September 2020 and authors’ calculations.
-
Note: Changes in May 2020 and September 2020 are calculated with respect to December 2019.
-
Note: Income in USD.
We use the estimates from Table 2 to simulate the change in individual labour income, and the last two columns of Table 3 to simulate the change in individual non-labour income as explained in the methodology. We then construct simulated household per capita income, for which we estimate a drop of 44% in May 2020 and 10% in September 2020 (see Table 4). As expected, we can see that the drop in household per capita income was driven mainly by the drop in individual labour income.
Change in household per capita income in 2019/2020
| December 2019 | May/June 2020 | September 2020 | |||
|---|---|---|---|---|---|
| Income | Income | Change | Income | Change | |
| Household per capita income | 214.49 | 120.21 | -43.95% | 193.18 | -9.93% |
| Household per capita labour income | 170.14 | 81.83 | -51.90% | 148.83 | -12.52% |
| Household per capita non-labour income | 44.35 | 38.38 | -13.46% | 44.30 | -0.13% |
-
Source: ENEMDU December 2019 and authors’ simulations of post-COVID incomes.
-
Note: Income in USD.
5.1. Heterogeneity in individual labour income shocks
In Table 5, we analyse the shocks to simulated labour income for key subgroups. We find that informal workers’ labour income was affected considerably more than formal workers’ (-60% vs. -42% in May 2020, and -17% vs. -8% in September 2020).12 This is particularly severe considering that 75% of workers are in the informal subgroup. Workers in urban and rural areas experienced a similar labour income shock (-52%), but income in urban areas recovered more by September (-12% vs. -16%). Also, rural workers earned considerably less than urban workers in all periods. When it comes to firm size, workers at small private firms saw their income affected more than those at big private firms did (-60% vs. -53% in May 2020 and -17% vs. -14% in September 2020), and public workers were least affected (-23% in May 2020 and +3% in September 2020). Note that 69% of workers are in small private firms, and 7% are public workers.
Monthly individual labour income pre- and post-COVID
| Group | % of workers | December 2019 | May/June 2020 | September 2020 | ||
|---|---|---|---|---|---|---|
| Income | Income | Change | Income | Change | ||
| By gender | ||||||
| Female | 37.33% | 389.26 | 205.62 | -47.18% | 343.53 | -11.75% |
| Male | 62.67% | 474.01 | 216.82 | -54.26% | 412.6 | -12.96% |
| By age | ||||||
| <26 | 11.11% | 309.61 | 137.88 | -55.47% | 265.76 | -14.16% |
| 26-65 | 80.64% | 476.93 | 231.60 | -51.44% | 418.23 | -12.31% |
| >65 | 8.25% | 282.97 | 127.95 | -54.78% | 242.50 | -14.30% |
| By ethnicity | ||||||
| Indigenous | 13.72% | 300.51 | 134.19 | -55.34% | 256.10 | -14.78% |
| Afro American | 5.03% | 379.83 | 181.32 | -52.26% | 321.26 | -15.42% |
| Mestizo/white | 73.95% | 470.54 | 227.53 | -51.65% | 414.01 | -12.02% |
| Other | 7.31% | 344.86 | 163.54 | -52.58% | 290.20 | -15.85% |
| By education level | ||||||
| No high school | 50.73% | 320.6946 | 130.5171 | -59.30% | 262.7539 | -18.07% |
| High school | 33.29% | 445.1933 | 201.1437 | -54.82% | 383.0887 | -13.95% |
| Higher education | 15.98% | 835.7534 | 506.4722 | -39.40% | 801.7644 | -4.07% |
| By employment type | ||||||
| Informal | 75.19% | 346.88 | 139.44 | -59.80% | 289.17 | -16.64% |
| Formal | 24.81% | 669.88 | 387.09 | -42.22% | 619.47 | -7.53% |
| By area | ||||||
| Rural | 28.92 % | 343.81 | 164.66 | -52.11% | 287.72 | -16.31% |
| Urban | 71.08% | 483.09 | 232.47 | -51.88% | 427.76 | -11.45% |
| By firm size | ||||||
| Big private (gt5 employees) | 23.8% | 576.07 | 268.50 | -53.39% | 497.93 | -13.56% |
| Small private | 68.99% | 339.61 | 135.30 | -60.16% | 282.72 | -16.75% |
| Public | 7.21% | 843.22 | 646.44 | -23.34% | 864.64 | 2.54% |
| By income decile | ||||||
| 1 | 10% | 111.88 | 49.19 | -56.03% | 92.11 | -17.67% |
| 2 | 10% | 185.98 | 78.47 | -57.81% | 152.43 | -18.04% |
| 3 | 10% | 248.93 | 106.49 | -57.22% | 207.91 | -16.48% |
| 4 | 10% | 274.42 | 113.7 | -58.57% | 227.43 | -17.12% |
| 5 | 10% | 304.21 | 128.83 | -57.65% | 255.47 | -16.02% |
| 6 | 10% | 344.37 | 143.86 | -58.23% | 285.62 | -17.06% |
| 7 | 10% | 382.19 | 168.71 | -55.86% | 323.78 | -15.28% |
| 8 | 10% | 444.31 | 204.22 | -54.04% | 381.42 | -14.15% |
| 9 | 10% | 529.2 | 268.01 | -49.36% | 471.92 | -10.82% |
| 10 | 10% | 976.74 | 525.97 | -46.15% | 896.08 | -8.26% |
-
Source: ENEMDU December 2019 and authors’ simulations of post-COVID incomes.
-
Note: Income in USD.
There are striking differences when it comes to education level. Workers with higher education were much less affected (-39% in May 2020 and -4% in September 2020) than high school graduates (-55% in May 2020 and -14% in September 2020) and those without a high school diploma (-59% in May 2020 and -18% in September 2020). In terms of age, the income shock was slightly worse for youth and seniors than for adults in May 2020 (-55%, -55%, and -51%, respectively) and in September 2020 (-14%, -14%, and -12%, respectively). In terms of ethnicity, the income shock was slightly worse for indigenous people (-55%) than for those in the other three ethnicity subgroups (-52%) in May 2020, and mestizos/whites recovered more than those in the other three ethnicity subgroups by September 2020 (-12% vs. -15%).
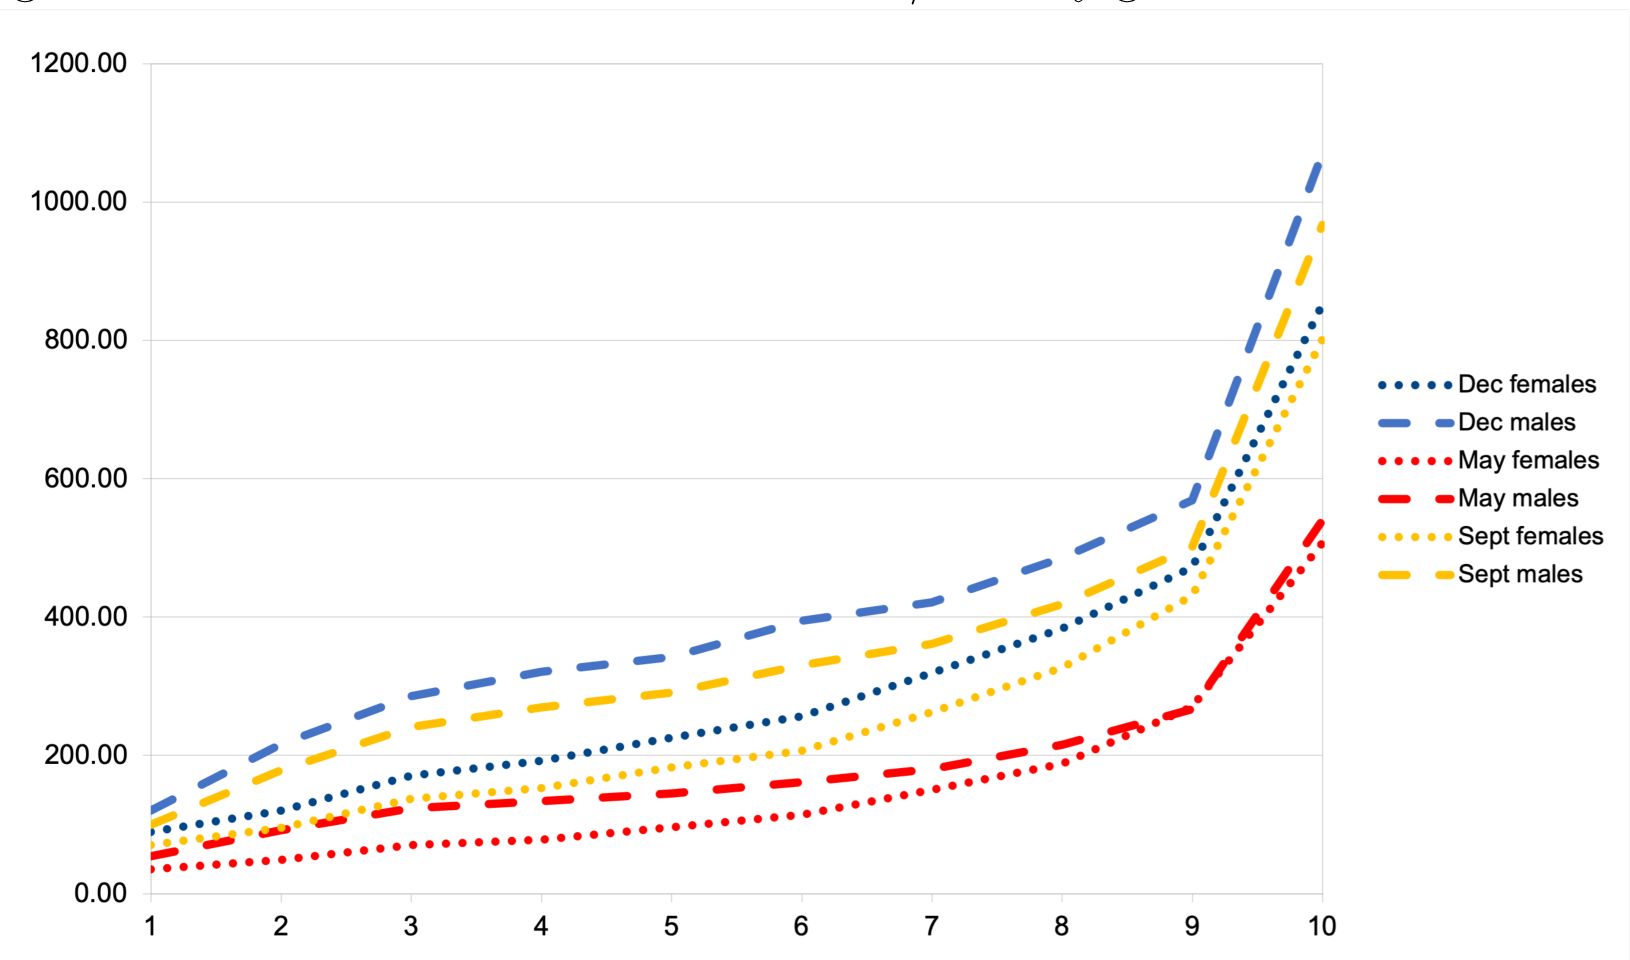
Males’ labour income was affected slightly more than females’ (-54% vs. -47% in May 2020, and -13% vs. -12% in September 2020), yet females still earned less than males in all periods. In Figure 1, we can see the gender gap in each decile. The income distributions for both males and females dropped severely in May 2020, which pushed the gender gap down; yet males recovered considerably more by September 2020. It is also worth noting that in December 2019, 17% of the labour force corresponded to unpaid workers, 62% of whom were female workers with zero income.

Individual labour income in 2019/2020 by gender and income decile. Source: ENEMDU December 2019 and authors’ simulations
Lastly, in the bottom panel of Table 5 we can see that the shock to labour income was considerable in all income deciles in May 2020 (around -57%), with deciles nine and ten experiencing the smallest drop (-49% and -46%, respectively). By September 2020, the change in income was around -16% for the lowest eight deciles, and -11% and -8% for deciles nine and ten, respectively.
5.2. Government interventions
Next, we consider the effect of government interventions – direct cash transfers under the Family Protection Bond for Emergencies program and additional spending on unemployment insurance. We add qualifying individuals’ corresponding share of these transfers to their simulated income as described in the methodology and use those values to compute household per capita income with transfers.
Table 6 compares mean household per capita income in December 2019 with simulated income in September 2020 with and without transfers. We see that the transfers had very little effect in the aggregate, with the average monthly income increasing by only $4. Yet, if we consider only individuals below the poverty line, the transfers increase their average monthly income by $6, which represents about 11% of their pre-COVID (December 2019) average monthly income and a recovery of 87% of the loss in their average household per capita income.
Average household per capita income pre-COVID and post-COVID with and without public transfers
| Dec. 2019 | Sept. 2020 simulated income | ||
|---|---|---|---|
| Income | Without transfers | With transfers | |
| All | 214.49 | 193.19 | 197.99 |
| Poor | 54.24 | 47.53 | 53.36 |
-
Source: ENEMDU December 2019 and authors’ simulations.
-
Note: Income in USD.
Figure 2 shows the distribution of incomes below minimum wage in December 2019 and simulated incomes in September 2020 with and without transfers. We can see how the COVID-19 crisis increased the density of the distribution below the minimum wage line and that the transfers had a small effect around the poverty line. The transfers compressed the left tail of the distribution, helping some households to get out of extreme poverty. This is also shown by the small bump between the extreme poverty line and the poverty line.
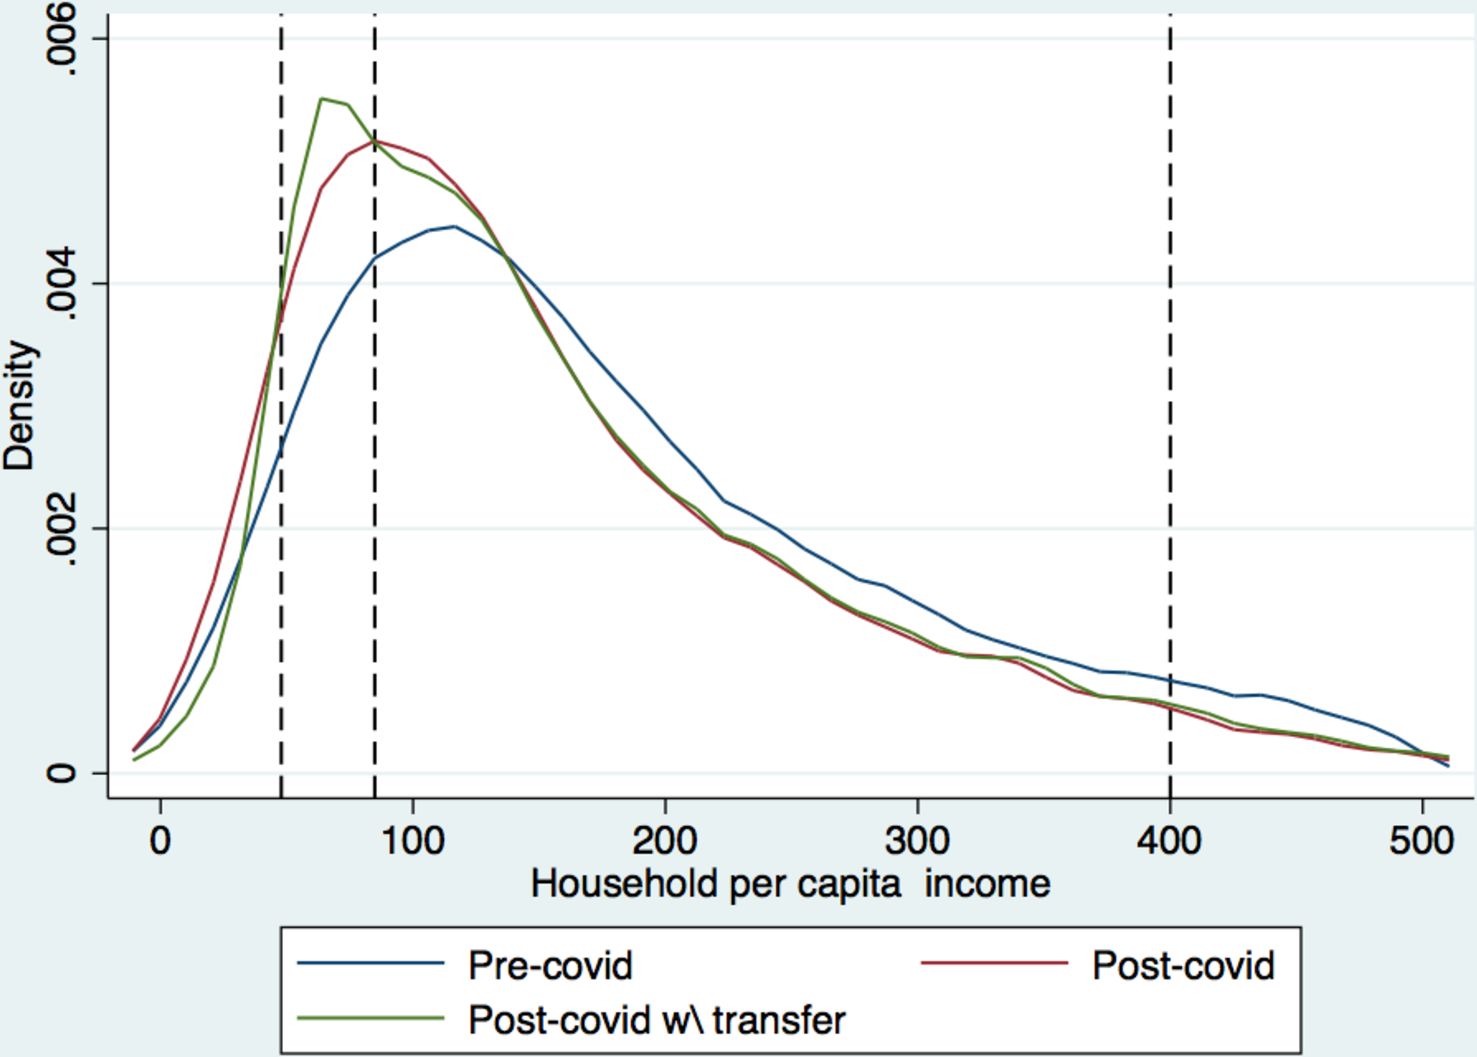

Income distribution pre-COVID and post-COVID (September 2020) with and without transfers. Source: ENEMDU December 2019 and authors’ simulations. From left to right, the dashed lines represent: the extreme poverty line ($47.80), the moderate poverty line ($84.81), and the minimum wage line ($400). Income in USD
5.3. Poverty and inequality
Table 7 shows the poverty rates in December 2019 and in May 2020 and September 2020 with and without transfers. The overall poverty rate more than doubled, climbing from 24% in December 2019 to 57% in May 2020 before falling back down to 30% in September 2020, which is still six percentage points higher than pre-COVID. In the aggregate, current government interventions had almost no impact on the poverty rate – around one percentage point.
Poverty rates pre-COVID and post-COVID with and without transfers
| December 2019 | May/June 2020 simulated income | September 2020 simulated income | |||
|---|---|---|---|---|---|
| Income | W/out transfers | With transfers | W/out transfers | With transfers | |
| All | 23.86% | 58.11% | 56.51% | 30.82% | 30.27% |
| By gender | |||||
| Female | 24.05% | 58.24% | 56.60% | 31.28% | 30.69% |
| Male | 23.66% | 57.97% | 56.40% | 30.34% | 29.84% |
| By age group | |||||
| [0, 14] | 34.13% | 71.48% | 69.93% | 42.69% | 42.10% |
| [15, 24] | 24.73% | 63.74% | 61.74% | 32.68% | 32.01% |
| [25, 40] | 20.62% | 56.16% | 54.31% | 27.66% | 27.12% |
| [41, 64] | 17.61% | 49.77% | 48.20% | 23.27% | 22.72% |
| [65+] | 13.30% | 31.34% | 30.77% | 16.54% | 16.35% |
| By ethnicity | |||||
| Indigenous | 49.27% | 80.06% | 79.84% | 57.45% | 57.41% |
| Afro American | 38.05% | 67.69% | 66.42% | 42.50% | 42.16% |
| Mestizo/white | 18.57% | 52.78% | 51.03% | 25.39% | 24.74% |
| Other | 24.83% | 62.14% | 60.56% | 32.26% | 31.96% |
| By education level | |||||
| No high school | 29.20% | 66.40% | 65.06% | 37.55% | 37.07% |
| High school | 12.90% | 46.44% | 44.03% | 17.84% | 17.05% |
| Higher education | 4.01% | 13.15% | 12.35% | 5.18% | 4.96% |
| By employment type | |||||
| Informal | 25.56% | 62.23% | 61.54% | 32.67% | 32.55% |
| Formal | 3.38% | 26.18% | 21.87% | 5.64% | 4.48% |
| By area | |||||
| Rural | 35.65% | 69.28% | 68.46% | 43.73% | 43.64% |
| Urban | 18.36% | 52.90% | 50.93% | 24.80% | 24.04% |
| By geographic region | |||||
| Sierra | 21.07% | 53.83% | 52.16% | 27.16% | 26.66% |
| Costa | 24.61% | 61.04% | 59.42% | 32.17% | 31.57% |
| Amazonia | 40.82% | 68.42% | 67.53% | 49.71% | 49.31% |
-
Source: ENEMDU December 2019 and authors’ simulations.
-
Note: The official poverty line is $84.81.
Poverty is particularly severe in rural areas. The rural poverty rate reached 68% in May 2020 and 44% in September 2020 – around 20 percentage points higher than in urban areas in all periods. In terms of geographic region, poverty is very severe in Amazonia, where the poverty rate was 68% in May 2020 and 50% in September 2020. Poverty is also particularly severe for informal workers, for whom the poverty rate was 62% in May 2020 and 33% in September 2020. In sharp contrast, the poverty rate for formal workers was 22% in May 2020 and 4% in September 2020. Note also that government interventions decreased the poverty rate of formal workers 4.38 percentage points in May 2020 – their largest impact among the categories in the table – mostly through unemployment benefits.
There are again big differences when it comes to education level. Those without a high school diploma had a poverty rate of 65% in May 2020 and 37% in September 2020. High school graduates are also vulnerable and had a poverty rate of 44% in May 2020 and 17% in September 2020. In contrast, the poverty rate for individuals with higher education was 12% in May 2020 and 5% in September 2020. In terms of age, sadly, kids fourteen and younger are the most vulnerable group, with a poverty rate of 70% in May 2020 and 42% in September 2020. Poverty rates drop steadily for each consecutive age group, with the oldest group (65 and older) having a poverty rate of 31% in May 2020 and 16% in September 2020. In terms of ethnicity, indigenous populations are the poorest group, with a poverty rate of 80% in May 2020, and 57% in September 2020. In contrast, the poverty rate for mestizos/whites was 51% in May 2020 and 25% in September 2020.
We do not find much difference between the poverty rates of males and females in any subcategory (See Table A1 in the appendix for poverty rates by gender for each subcategory). However, since poverty is measured at the household level (using household per capita income), the gender gap in poverty rates may be underestimated. Indeed, the measurement implicitly assumes that all household members enjoy the same standard of living, which may not necessarily be true (see Munoz Boudet et al., 2018, for a discussion of gender differences in poverty).
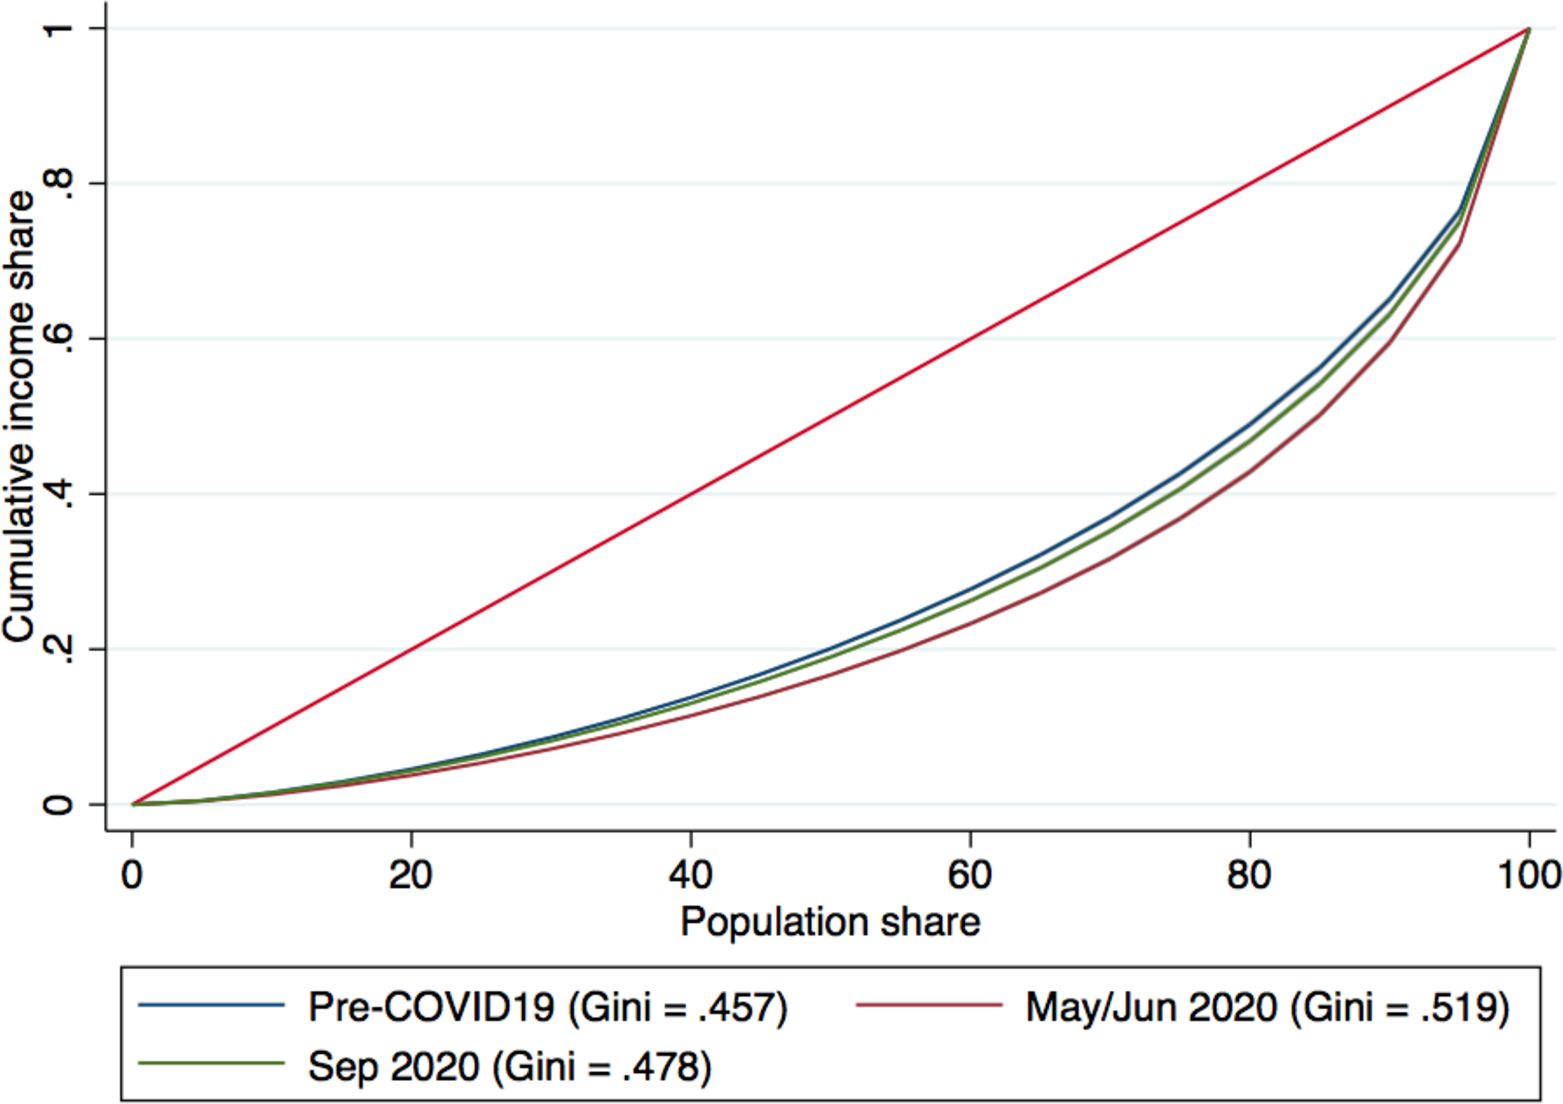
In terms of inequality, Figure 3 shows Ecuador’s Lorenz curves and Gini coefficients before and after the COVID crisis. In December 2019, Ecuador’s Gini coefficient was 0.457, which was higher than the average Gini coefficient of the other Andean countries (Bolivia, Colombia, and Peru, average = 0.448) and lower than that of the Latin American and Caribbean region (0.51).13,14 Ecuador’s Gini coefficient reached 0.52 in May 2020 (comparable to that of Brazil, the most unequal country in the region, in 2019), and went back down to 0.48 in September 2020.

Lorenz curves pre- and post-COVID. Source: ENEMDU December 2019 and authors’ simulations.
We also look at percentile ratios of the distribution of household per capita income pre-COVID and post-COVID with and without transfers to differentiate changes among the poorest, the middle class, and the richest (see Table 8). The first column in the table () shows that in December 2019 the average household per capita income of individuals in the top decile of the distribution () was around eight times higher than that of those in the bottom decile (). If government interventions are not accounted for, the difference between these two deciles was tenfold in May 2020, but public transfers seem to have had a small equalising effect and reduce the ratio to 8.77. In September 2020, the ratio was down to 8.42 without public transfers and 7.59 with them. We see similar patterns, albeit with less variation, when looking at the income ratios of closer deciles.
Inequality measures pre- and post-COVID
| Percentile ratios | Gini | ||||
|---|---|---|---|---|---|
| p90/p10 | p90/p50 | p50/p10 | p75/p25 | ||
| December 2019 | 7.65 | 2.81 | 2.72 | 2.88 | 0.46 |
| May/June 2020 without transfers | 10.43 | 3.63 | 2.87 | 3.28 | 0.52 |
| May/June 2020 with transfers | 8.77 | 3.61 | 2.43 | 3.14 | 0.50 |
| September 2020 without transfers | 8.42 | 3.05 | 2.76 | 2.97 | 0.48 |
| September 2020 with transfers | 7.59 | 3.05 | 2.49 | 3.01 | 0.47 |
-
Source: ENEMDU December 2019 and authors’ simulations.
Conclusion
This study shows the delicate economic situation in Ecuador. Mean labour income dropped by more than half in May 2020, while the poverty rate more than doubled compared to the pre-COVID (i.e., December 2019) level. The economic situation had improved by September 2020, when the drop in income represented 10% of the pre-COVID level and the poverty rate was 6 percentage points above its pre-COVID level. Income inequality was up considerably in May 2020, and partially improved by September 2020. When evaluating government transfers in response to the crisis, we see that they had very limited effects on average income in the aggregate. Yet, they may have been crucial for the subsistence of individuals below the poverty line.
The crisis affected individuals across the income distribution; only the top two deciles experienced a somewhat smaller initial shock and faster recovery. The populations most affected were informal workers, workers in small private firms, workers in rural areas, indigenous populations, households with young children, and households in the Amazonia region. In terms of gender, males’ labour income was affected slightly more than females’, yet females still earned considerably less than males across the income distribution in all periods. Furthermore, during the first trimester of the crisis (by May 2020), employment decreased 26% for females vs. 20% for males.
At the time this article was written (2021), our main recommendation for the Ecuadorian government was to invest in more vaccines in order to normalise economic activity because only 15% of the population had had a first dose and the government was still struggling to get more vaccines. Yet, over the past year, the government has done a great job getting vaccines: more than 79% of the population has received two doses, and 25% has received a third dose. Beyond vaccines, future relief efforts should pay particular attention to informal workers, rural workers, and poor households with young children. Since 75% of the labour force is in the informal subgroup with no access to social security benefits, investment in direct cash transfers is likely to be more effective than wage subsidies or unemployment benefits.
By evaluating the impact of COVID-19 among different groups of the population and by simulating the effectiveness of government interventions, we hope to guide policymakers in developing more efficient interventions to alleviate the economic impact of the pandemic.
Footnotes
1.
Socio-Economic Database for Latin America and the Caribbean
2.
Productive informality: an individual is considered an informal worker if (s)he belongs to any of the following categories: (i) unskilled self-employed, (ii) salaried worker in a small private firm, (iii) zero-income worker.
3.
Diario el Comercio: Ley de Apoyo Humanitario se publicó en el Registro Oficial, ¿qué implica? (last accessed 20 October 2020)
4.
5.
See IMF (2020) report for the amount spent on individual programs.
6.
Encuesta Nacional de Empleo y Desempleo (ENEMDU).
7.
We do not have data on price changes per category, nor consumption per category. Thus, we capture the effect of price changes by considering changes in real income.
8.
We rely on shocks by gender/economic sector because the sampling strategy had to change to adapt to lockdown in 2020 and, thus, the data sets are not comparable at the micro level –comparing income regression with full demographics in each period would be misleading. Yet, all the data sets are representative at the macro level and thus shocks by sector are more transparent.
9.
Unfortunately, there was a problem with the remittance variable in the 2019 data; we can thus consider only total non-labour income.
10.
Since we do not know who lost their job, we give all qualifying workers an equal share of the unemployment budget.
11.
We also estimated the probability of unemployment in May 2020 and September 2020 with logit regressions on available demographics and used these regressions to estimate the probability of unemployment of each worker in the 2019 data set; we then distributed the funds to all individuals who were formal workers in December 2019 proportionally to their probability of unemployment in 2020. The results remain virtually unchanged. The results are available upon request.
12.
Informal worker: an individual is considered an informal worker if (s)he lacks social security coverage.
13.
Data was not available for Venezuela.
14.
World Bank World Development Indicators.
Appendices
Share of poor individuals by gender pre- and post-COVID
| Females | Males | |||||
|---|---|---|---|---|---|---|
| Dec. 2019 | May 2020 | Sept. 2020 | Dec. 2019 | May 2020 | Sept. 2020 | |
| All | 0.24 | 0.58 | 0.31 | 0.24 | 0.58 | 0.30 |
| By area | ||||||
| Rural | 0.36 | 0.70 | 0.44 | 0.35 | 0.68 | 0.43 |
| Urban | 0.19 | 0.53 | 0.25 | 0.18 | 0.53 | 0.24 |
| By employment type | ||||||
| Informal | 0.26 | 0.61 | 0.33 | 0.25 | 0.63 | 0.32 |
| Formal | 0.02 | 0.18 | 0.03 | 0.04 | 0.32 | 0.07 |
| By age group | ||||||
| [0, 14] | 0.33 | 0.72 | 0.42 | 0.35 | 0.71 | 0.43 |
| [15, 24] | 0.26 | 0.65 | 0.34 | 0.23 | 0.63 | 0.31 |
| [25, 40] | 0.23 | 0.59 | 0.30 | 0.18 | 0.54 | 0.25 |
| [41, 64] | 0.17 | 0.48 | 0.23 | 0.18 | 0.51 | 0.24 |
| [65+] | 0.12 | 0.30 | 0.16 | 0.14 | 0.33 | 0.18 |
| By ethnicity | ||||||
| Indigenous | 0.50 | 0.80 | 0.57 | 0.49 | 0.80 | 0.57 |
| Afro American | 0.37 | 0.68 | 0.42 | 0.39 | 0.67 | 0.43 |
| Mestizo/white | 0.19 | 0.53 | 0.26 | 0.18 | 0.53 | 0.25 |
| Other | 0.26 | 0.63 | 0.34 | 0.24 | 0.61 | 0.31 |
| By education level | ||||||
| No high school | 0.30 | 0.67 | 0.38 | 0.29 | 0.66 | 0.37 |
| High school | 0.14 | 0.48 | 0.20 | 0.12 | 0.45 | 0.16 |
| Higher education | 0.03 | 0.12 | 0.05 | 0.05 | 0.14 | 0.06 |
| By geographic region | ||||||
| Sierra | 0.21 | 0.54 | 0.27 | 0.21 | 0.54 | 0.27 |
| Costa | 0.25 | 0.61 | 0.33 | 0.24 | 0.61 | 0.31 |
| Amazonia | 0.41 | 0.69 | 0.50 | 0.41 | 0.68 | 0.49 |
References
-
1
New Century, Old Disparities. Gender and Ethnic Wage Gaps in Latin AmericaInter-American Development Bank.
-
2
The Coronavirus and the Great Influenza Pandemic: Lessons from the “Spanish Flu” for the Coronavirus’s Potential Effects on Mortality and Economic ActivityNational Bureau of Economic Research.
-
3
The Unequal Impact of the Coronavirus Pandemic: Evidence from Seventeen Developing CountriesInter-American Development Bank.
- 4
-
5
Informality and poverty in EcuadorSmall Business Economics 53:1097–1115.https://doi.org/10.1007/s11187-018-0102-9
-
6
Gender and Ethnic Inequalities in LAC CountriesIZA Journal of Labor & Development 3:18.
-
7
Earnings Inequality Within And Across Gender, Racial, And Ethnic Groups In Four Latin American CountriesThe World Bank.https://doi.org/10.1596/1813-9450-4591
-
8
Ilo Monitor:Covid-19 and the World of Work. Seventh Edition Updated Estimates and AnalysisHelsinki, Finland: ILO Briefing note.
-
9
Ecuador: Solicitud de Un Acuerdo En El Marco Del Servicio Ampliado Del Fmi: Comunicado de Prensa; Informe Del Personal Técnico; Suplemento Del Personal Técnico; y Declaración Del Director Ejecutivo Por EcuadorEcuador: Solicitud de Un Acuerdo En El Marco Del Servicio Ampliado Del Fmi: Comunicado de Prensa; Informe Del Personal Técnico; Suplemento Del Personal Técnico; y Declaración Del Director Ejecutivo Por Ecuador, FMI, Informe de país no. 20/150, Washington DC.
-
10
WIDER Working Paper 2021/4The role of automatic stabilizers and emergency tax–benefit policies during the COVID-19 pandemic in Ecuador, WIDER Working Paper 2021/4, Helsinki, Finland, 10.35188/UNU-WIDER/2021/938-9.
-
11
Gender Differences in Poverty and Household Composition through the Life-Cycle: A Global PerspectiveWashington, DC: World Bank.
-
12
Ley Orgánica de Apoyo HumanitarioLey Orgánica de Apoyo Humanitario, Suplemento del Registro Oficial No 229, Quito.
- 13
Article and author information
Author details
Juan David Robalino

Funding
This research work was carried out with financial and scientific support from the Partnership for Economic Policy (PEP; www.pep-net.org) and funding from the United Kingdom’s Department for International Development (DFID or UK Aid) and the Government of Canada through the InternationalDevelopment ResearchCenter (IDRC).
Acknowledgements
This research work was carried out with financial and scientific support from the Partnership for Economic Policy (PEP; www.pep-net.org) and funding from the United Kingdom’s Department for International Development (DFID or UK Aid) and the Government of Canada through the International Development Research Center (IDRC). The authors are also grateful to Guillermo Cruces and Lucas Ronconi for their technical support, guidance, and valuable comments and suggestions.
Publication history
- Version of Record published: December 31, 2022 (version 1)
Copyright
© 2022, Carla and Juan
This article is distributed under the terms of the Creative Commons Attribution License, which permits unrestricted use and redistribution provided that the original author and source are credited.