Impact of the Covid-19 Pandemic on Monetary Child Poverty in Morocco
- Université Mohammed VI Polytechnique - FGSES – AIRESS, Morocco
Abstract
The Covid-19 pandemic had a very quick and damaging impact on several economies around the world, including in Morocco. This economy was hit hard with some sectors strongly exposed to the impact on the households and their children. In this article, we built a micro-simulation model and use it jointly with an input-output model to assess the distributional impact of COVID-19 and mitigation measures targeting households in Morocco with a focus on children living in poor households. Our original results show that the crisis has led to a fairly significant increase in poverty, with more pronounced effects in the urban area. Children under 5 years of age and young adults (over 18 years of age) are the most affected. Just over half a million children under the age of 18 would fall into poverty as a result of the pandemic. The mitigation measures put in place by the government and additional measures we designed and simulated further reduce the negative impact of the pandemic. In addition, the number of vulnerable rural population has decreased in both rural and urban areas. However, the two scenarios focusing on mitigation of the effects of the pandemic do not fully compensate for the negative effects of the pandemic in the urban area as opposed to rural areas. When we focus our analysis by age category, the incidence rates of vulnerability decrease to their initial rates for children under 5 years of age and decrease very slightly for youth aged 5 to 17 years at the national level. However, we find that this vulnerability is deeper and more severe even after the implementation of compensatory measures.
1. Introduction
The Covid-19 pandemic had a very quick and strong economic and social impact in most countries around the world. The crisis was one of the worst in terms of potential social and economic impact according to Sanchez-Paramo (2020). After four months into the pandemic, Bank (2020) projected that Covid-19 would push between 71 and 100 million people into extreme poverty. By late 2021, Lara Lara and Mendez Ramos (2021) estimated that 116 million people fell into extreme poverty. In such a context, it was key to understand and identify to most vulnerable households and investigate public responses to this crisis. Sanchez-Paramo (2020) proposed quick measures targeting the most vulnerable such as cash transfers by relying on existing programs and adding additional ones. In addition, understanding transmission mechanisms between the crisis and government measures to contain the pandemic are also extremely important.
Our analysis was done in this context to help understand the distributional impact of the pandemic in Morocco and the lockdown, to verify the efficiency of mitigation measures implemented by the government, and to test additional policy responses. The first Covid 19 case was declared on March 2nd, 2020 (HCP-UN-WB, 2020). According to OECD (2020), the Moroccan economy was hit hard with some sectors strongly exposed such as tourism, air transport, and exporting sectors (textile and automotive). These sectors were affected on the supply and demand sides. Other sectors were less exposed namely the ones with limited face-to-face interaction (telecommunication, finance) and essential sectors such as agro-industries, extraction, and chemical. Haddad et al. (2020) attribute the first recession since 1995 to the collapse of external demand and the strict lockdown that lasted around 14 weeks from mid-March to the end of June. By the end of the lockdown measures (in July), the daily growth rate of cases was at 5.5%, the prevalence rate at 1%, and lethality at 4% (HCP-UN-WB, 2020). By the end of July 2020, around 25000 cases were confirmed (Coronavirus Statistics, 2022).
In this article, we propose an input-output approach linked to a microsimulation model to assess the impact of COVID-19 on poverty and vulnerability in Morocco, focusing on children living in poor households. This approach has been used to assess the effects of a carbon tax in Spain by Labandeira and Labeaga (1999), but to our knowledge has not been used to assess the impact of Covid-19 on child poverty. Hence, the main objective of this paper is to illustrate how this methodology can be used to perform a very detailed distributional analysis. Our secondary objective is to provide a detailed distributional analysis of the impacts of COVID-19 and mitigation measures with a focus on children. This methodology developed and applied to the COVID-19 crisis in Morocco was performed in the early months of the strict confinement in the country. During the early stages of the pandemic, given early indications of strong economic and social negative impact, there was a need and interest to understand the distributional impact of the pandemic and responses. Hence, our analysis provided quick insights in this direction and our microsimulation model remained available for continued monitoring of the evolution of the pandemic. We were able to exploit all early information available to design our simulations.
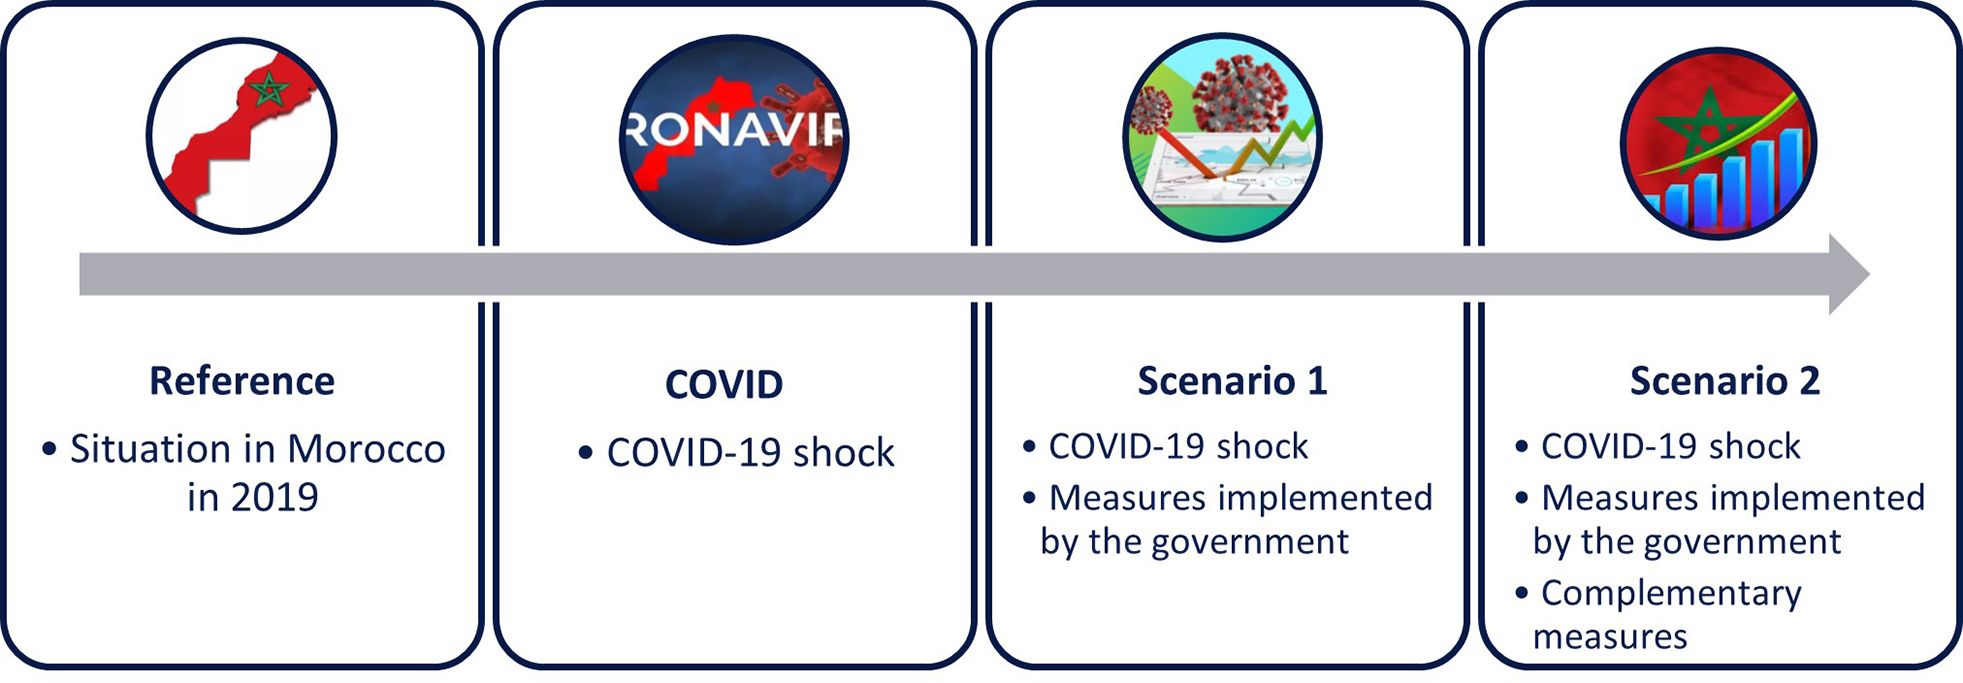
This paper is structured as follows. After presenting how COVID-19 spread through the Moroccan economy and its population in its early stages, we highlight the direct and indirect transmission channels on poverty, especially among children. We then present the input-output and micro-simulation models developed and adapted to the Moroccan economy, the hypotheses formulated and the data used. Three simulations are proposed: the first will allow us to evaluate the impact of the pandemic on poverty (Covid); with the second, we simulate some of the policies implemented by the country in response to the spread of the virus (scenario 1). Finally, in a third simulation, we run alternative policy responses to attenuate the impact of the crisis on poor households and their children generated by the initial simulation (scenario 2). Different tools are used to perform the distributional impact analysis of our scenarios.
2. Transmission channels of COVID-19 in the Moroccan economy and on poverty
Following the discovery of the first cases of infection in early March 2020, the Moroccan government put in place rapid and drastic measures. The closure of schools (March 13th) and borders (March 9th) at the beginning with the most affected European countries and then with all countries were the first measures. On March 20th, a state of health emergency was declared, leading to strict lockdown measures for the population. Several other countries in the world also took similar measures. These internal and external measures had an impact on Morocco’s economic activity as well as on its vulnerable population. The transmission channels of the pandemic on the economy are multiple which we will describe partially hereinafter.
In terms of GDP, a couple of months into the pandemic, the three Moroccan organizations that monitor the economic situation revised their economic growth forecasts for the country from 3.8% to 2.3% for the Central Bank (BAM), from 3.5% to 2.2% for the Haut-Commissariat au Plan (HCP), and finally, the Centre marocain de conjoncture (CMC) from 4.5% to 0.8%. It should be noted that these updated forecasts took into account the rainfall deficit in addition to the COVID-19 effects. For its part, the International Monetary Fund (IMF) made a much more pessimistic revision, with a growth forecast going from 3.0% to a drop in GDP of 3.7% for the year 2020 (International Monetary Fund-IMF, 2020).1 It turns out that these forecasts were on the optimistic side as reported by the International Monetary Fund-IMF (2021),2 the Moroccan GDP contracted by 5,9% in 2020 according to African Development (2021) and 6,3% according to International Monetary Fund-IMF (2021). The sectors most strongly affected were the tourism sector, followed by the transport sector, construction, and manufacturing. Haut-Commissariat au Plan (2020a), the strong contraction of the economy in the second and third quarters is because the country is facing a multidimensional crisis (pandemic) that affected all sectors and also partner countries including the European Union.3
2.1. Economic impact
As we stated, the pandemic and measures taken by the government inside and outside the country generated a strong contraction of GDP (-6.7%) (Ministre de l’économie et des Finances-MEF, 2021). In terms of inflation, for the month of March, the HCP released data with the CPI rising by 0.4% during the month of March and noting an increase in the CPI of 1.5% over 12 months. Breaking down the index, the HCP noted that the food index rose 1.3 percent while the non-food index fell 0.2 percent. The largest price increases were for vegetables (6.3%), fish and seafood (1.9%), and fruit (1.7%). (CDG, 2020). By the end of the year, a 0.7% increase over 2019 was observed. As a result of the increase in the index of food products by 0.9% and that of non-food products by 0.5%. The variations recorded for non-food products range from a decrease of 1.6% for "Transport" to an increase of 2.7% for "Education" (HCP, 2021). In the first months of the pandemic (April and May 2020), the biggest price drop was in fuel prices, which fell by 6.8%.
For public finances, according to (Ministre de l’économie et des Finances-MEF, 2021) the state budget deficit increased from 3.6% of GDP in 2019 to 7.7% and the treasury debt increased from 64.9% of GDP in 2019 to 77.6% and the unemployment rate rose from 9,2% to 11,9% for 2020 following the pandemic.
At the household level in Morocco, with the confinement of the population and the total or partial cessation of several economic activities, both in the formal and informal sectors, many workers suddenly lost their jobs, whether permanent or seasonal, and have therefore temporarily or permanently lost their main source of income. On April 22, after one month of confinement, the HCP published the main results of its qualitative survey on the effect of the economic situation and COVID-19 on business activity (Haut-Commissariat au Plan, 2020a).4
The survey showed that 3% of the companies in the sectors surveyed had stopped their activities permanently and 54% have stopped their activities temporarily. The most affected sectors are accommodation and food services, with 89% of companies in this sector having to stop their activities either permanently or temporarily. The industrial sector has also had a marked impact with permanent or temporary closures ranging from 55% in the chemical and parachemical industries to 76% in the textile and leather industries (Table 1).
Share of companies in permanent/temporary lockdown by sector of activity (during the period of lockdown)*
| All sectors | 57% |
|---|---|
| Metal and mechanical industries | 73% |
| Electrical and electronic industries | 56% |
| Chemical and pararchemical industries | 55% |
| Textile and leather industries | 76% |
| Agro-industries | 34% |
| Mining | 32% |
| Energy | 63% |
| Fishing | 24% |
| Services to individuals | 60% |
| Education and human health | 43% |
| Corporate services | 65% |
| Real estate activities | 63% |
| Information and telecommunication | 48% |
| Hotel and restaurant | 89% |
| Transport and storage | 54% |
| Trade | 46% |
| Construction | 59% |
-
Source: Haut-Commissariat au Plan (2020a).
-
*
The lockdown measures started on March 9th and a first wave of restrictions were removed on June 9th and a second wage at the end of July 2020.
On the other hand, 43% of the companies surveyed remained active since the beginning of the crisis. Of these, 81% halved their activity and nearly 50% are very small, small, and medium-sized enterprises. The construction and service sectors are the ones that have slowed down the most (62% and 54% respectively).
The Confédération générale des entreprises du Maroc (Confédération générale des entreprises du Maroc-CGEM, 2020) in its preliminary report published on April 24th based on a survey found that nearly two-thirds of respondents have decreased their activity by at least 30% and that only 7.5% have maintained a stable activity following the appearance of the virus in Morocco.
This slowdown in economic activity has had a de facto impact on employment. The International Labour Office (ILO) estimates that nearly 230 million workers have lost their jobs worldwide, including 30 million in sub-Saharan Africa and the Arab States. Moreover, the ILO estimates that 26.4% of the jobs lost are in high-risk sectors in Africa and 33.2% in the Arab States. Finally, the analysis shows that almost three-quarters of non-agricultural jobs are in the informal sector on the African continent. For the Arab States, this figure is 64%. (International Labour, 2020).
In Morocco, in April 2020, the HCP estimated that 20% or nearly 726,000 jobs (excluding agriculture and the financial sector) would be lost, the majority (57%) in very small, small, and medium-sized enterprises (Haut-Commissariat au Plan, 2020a). For the CGEM, more than 55% of the jobs in companies that participated in the survey are at risk and for nearly 50% of them, it was anticipated that the pandemic could have an impact on more than 75% of their jobs (Confédération générale des entreprises du Maroc-CGEM, 2020). In addition, among the sectors that experienced the greatest slowdown in March 2020, the tourism sector suffered the greatest drop in the number of jobs (78.24% job loss in the sector) followed by the textile (70.39%) and real estate (70.31%) sectors. The primary sector (agriculture, poultry farming, fishing), despite a slowdown in its activity (between 30 and 40%), seemed to be less affected in terms of job losses.
In the summary note dated May 19, 2020, the HCP publishes the preliminary results of its household survey, conducted between April 14 and 23, 2020 on some 2,350 households representative of the socio-economic classes of the Moroccan population and living in urban and rural areas (Haut-Commissariat au Plan, 2020c). The survey found that 34% of households reported having lost all sources of income during the initial stages of the lockdown period. Almost half of the households have at least one member who has been forced to stop working, and 40% of them have received assistance from either their employer or the government.
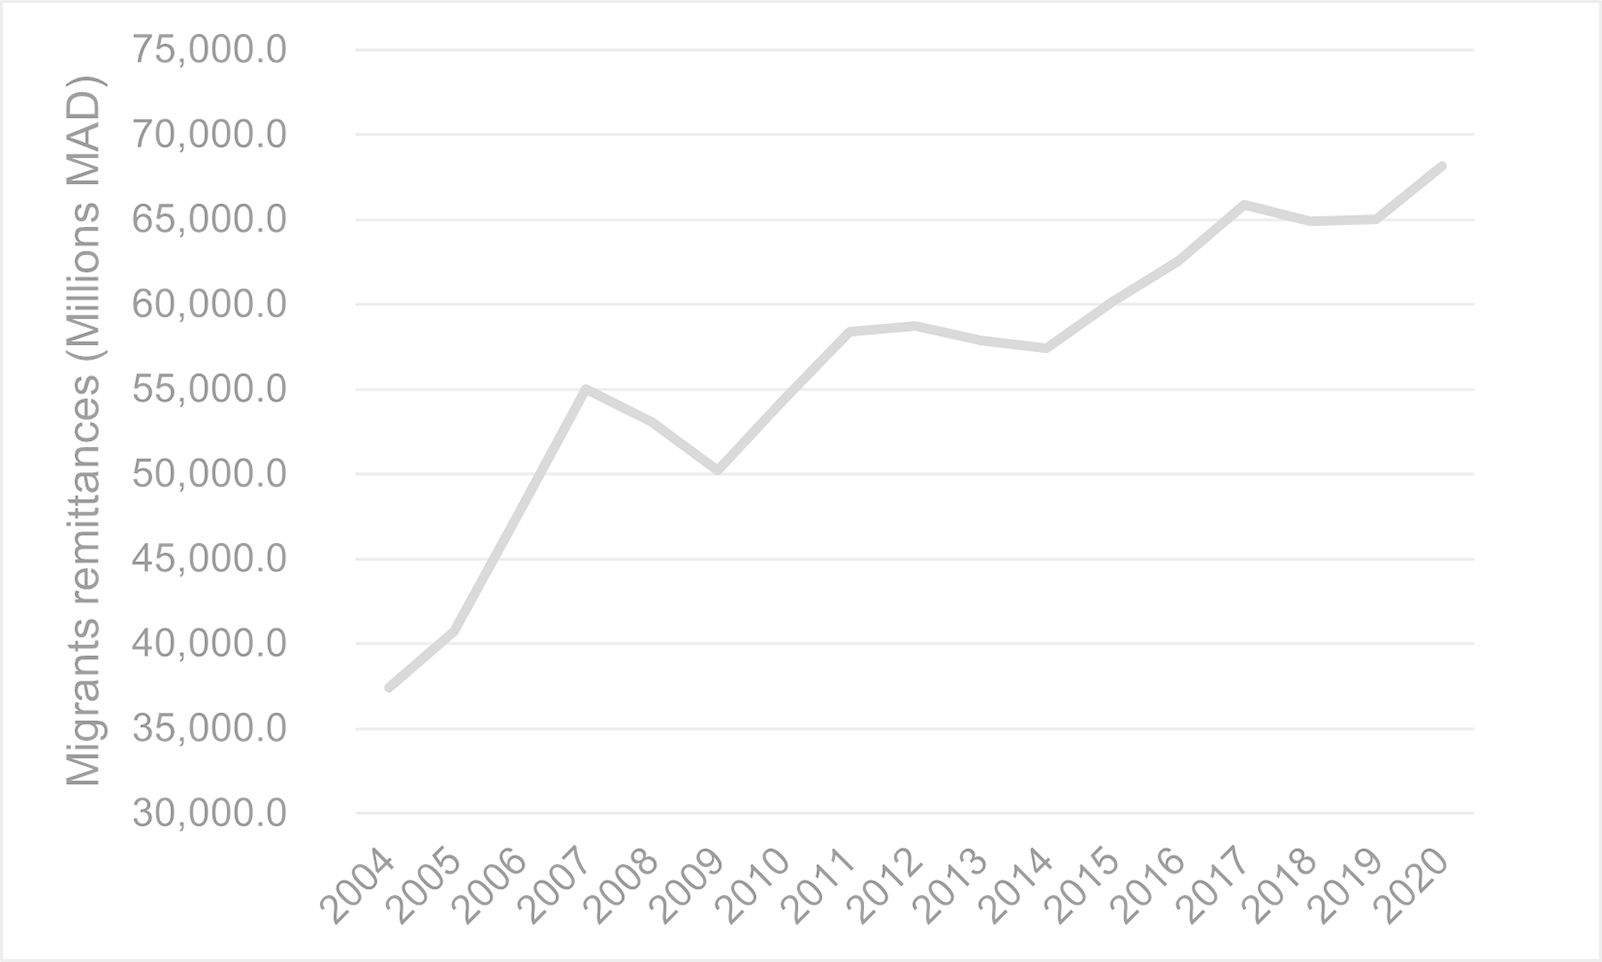
Moreover, in many countries, including those in the MENA region, remittances from abroad constitute a significant source of household income. These remittances have a positive impact on household welfare, both in monetary (poverty reduction) and non-monetary (health, nutrition, education) terms. However, the pandemic also had an impact on the host countries of many Moroccans living abroad (European countries, Gulf countries, North America, etc.). In the early stages of the pandemic and lockdowns, the World Bank anticipated a decline in remittances of around 20% globally, with a similar percentage in MENA countries (Bank, 2020). In the case of Morocco, Iñigo Moré estimates that remittances from the European Union fell by 30% between February and March 2020 and that this drop could be greater than 50% in April (Azougah, 2020).5 The World Bank estimates that in 2019, Moroccan households received 66.75 billion dirhams (US$6.7 billion) and 64.78 billion according to the Moroccan Exchange Office (Figure 1). In addition, it is estimated that 20 to 30% of Moroccan households receive remittances from migrants living abroad.

Remittances from Moroccan migrants. Source: Office des changes (Séries statistiques | Office des Changes (oc.gov.ma)).
2.2. On poverty
In the early stages of the pandemic, many organizations presented reports on the impacts that COVID-19 could have on the poorest populations. Unanimously, these reports pointed to a significant setback in the progress that had been made on poverty reduction objectives. As many households are dependent on a single member for their income. The lockdown impacted directly the economic activity in certain sectors likely pushing many of these households into poverty.
For example, in March 2020, (Vos et al., 2020) use a global CGE model in combination with a micro-simulation model to estimate that extreme poverty could increase by 2 to 3 percentage points in developing countries. Thus, according to their first estimates, between 14 and 22 million people could fall into extreme poverty and nearly half of them would be from sub-Saharan Africa. One month later, the same authors conclude that 140 million people are at risk of falling into extreme poverty, including 80 million on the African continent (Laborde et al., 2020). This change in the authors' estimates is due in large part to the lockdown enacted in many countries that have resulted in a sharp slowdown in economic activity in some sectors, and certain cases a complete halt in activities. From the detailed early data,6 it was estimated by Haut-Commissariat au Plan (2020a) in the early stages of the pandemic that 30,000 people could fall into extreme poverty in Morocco, an increase of 8.5%.7
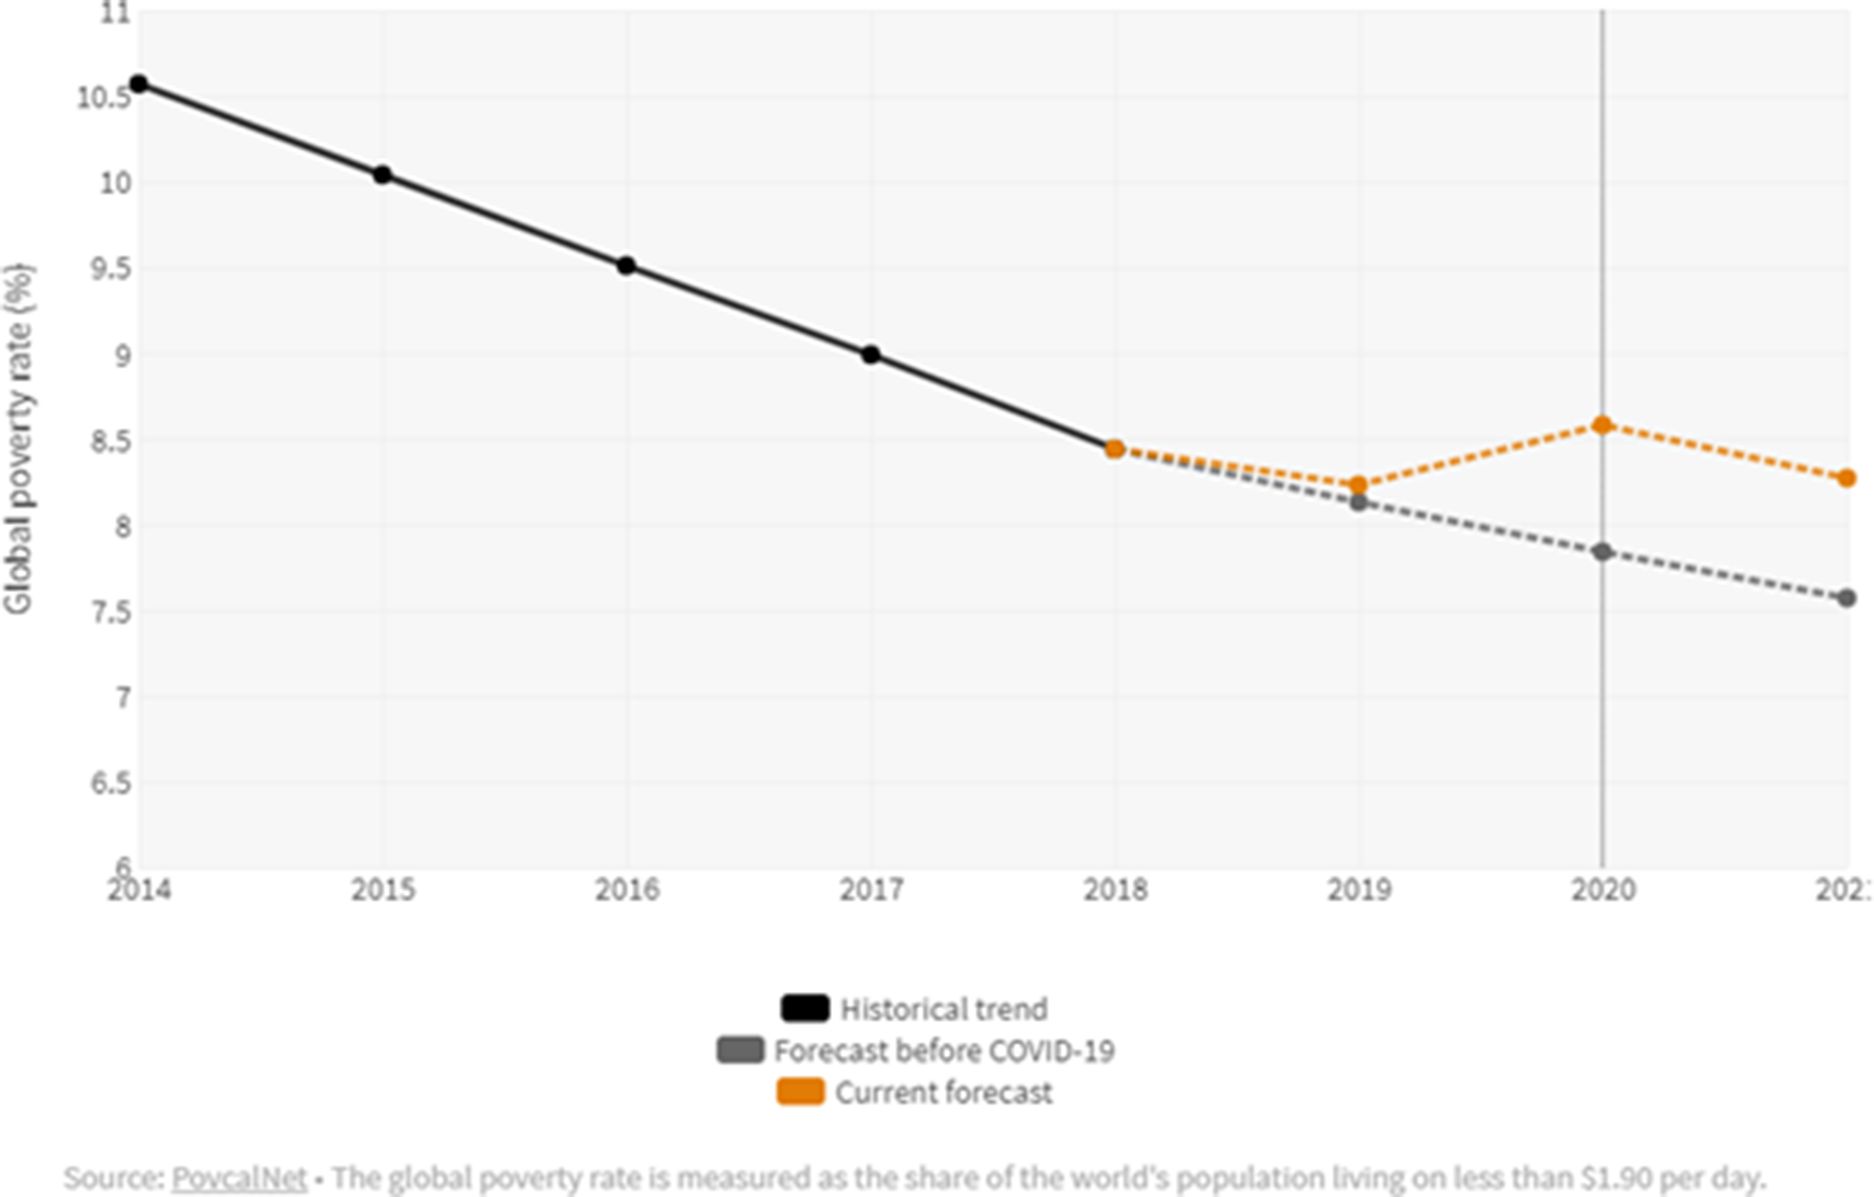
Gerzon Mahler et al. (2020), on their part, apply a nowcasting approach using household dataset and growth forecasts and estimate that between 40 and 60 million people, including 2.8 million in MENA countries, could be pushed into extreme poverty, depending on the growth assumptions used, resulting in a reversal of the gains of at least three years (Figure 2). In addition, beyond the loss of the main income in poor and vulnerable households, the sanitary measures put in place to limit the spread of the virus could also increase inequalities, especially in the urban area (United Nations Development, 2020).

Impact of COVID-19 on global poverty. Source: Gerzon Mahler et al. (2020).
Gerzon Mahler et al. (2021) using the same approach (nowcasting) provide an estimate of the impact of COVID-19 on global poverty. They perform a nowcasting approach for their analysis using high-frequency phone surveys. They first estimated, in January 2021, that between 119 and 124 million people were pushed into extreme poverty globally. By using more recent data, they revised this number down to 97 million by June 2021. Albeit, this number is reduced, according to the authors, this is an unprecedented increase in extreme poverty.
Summner et al. (2020) also use nowcasting using the PovcalNet database and growth estimates. They simulate some scenarios to measure the short-term impact of Covid. They estimate that with a 20 percent income or consumption contraction in the world, the number of people living in poverty could increase by 420-580 million, relative to the latest official recorded figures for 2018.
3. Data and methodology
3.1. Data
In this paper, for the micro-simulation model part, we use data from the 2019 wave of the Enquête panel des ménages (EPM) of the Observatoire national du développement humain (ONDH). This survey was first implemented in Morocco in 2012. It consists of annually following the same households and members of the sampled households visited in the reference year (2012), the first wave of the panel.
In 2017 and 2019, ONDH sought to ensure regional representativeness (the 12 regions of the country in addition to national representativeness and by area of residence). In 2019, 16,879 households were surveyed.
In 2019, the questionnaire for this survey has 17 components and provides information on the main dimensions of human development such as demography, education, health and access to basic services, income, consumption expenditure, detailed food expenditure, detailed non-food expenditure of each household (in volume and value) as well as all transfers paid and/or received by them. It also covers all relevant information on household members (socio-demographic characteristics, literacy, education, employment, unemployment, economic activity, health insurance coverage, morbidity and access to health care, under-five mortality, borrowing, sources of income, housing and living conditions, etc.).
The wealth of information contained in this survey, and to which we had access, allows us to conduct the analysis for this paper according to the methodology chosen.8 Table 2 presents the distribution of the EPM sample of the ONDH (wave 2019) at the household and individual levels. Table 3 shows the distribution of the Moroccan population in 2019.9
Distribution of households and individuals in the ONDH 2019 EPM sample by area of residence
| Freq. | % | |
|---|---|---|
| Households | ||
| Urban | 9 845 | 58.3% |
| Rural | 7 034 | 41.7% |
| Morocco | 16 879 | 100% |
| Individuals | ||
| Urban | 39 033 | 54.4% |
| Rural | 32 765 | 45.6% |
| Morocco | 71 798 | 100% |
-
Source: Authors’ computation based on the ONDH Household Panel Survey (2019 wave).
Distribution of the Moroccan population by area of residence
| Individuals | Freq. | % |
|---|---|---|
| Urban | 2 2369 714 | 62.9% |
| Rural | 13 201 998 | 37.1% |
| Morocco | 35 571 711 | 100% |
-
Source: Authors’ computation based on the ONDH Household Panel Survey (2019 wave).
3.2. The micro-simulation model
In this paper, the model is broken down into three interdependent modules. The first module is a macro-sectoral model that allows to simulate variations in the prices of goods following different shocks (price block). The other two modules are directly linked to the EPM survey used. One deals with household expenditure on different products (expenditure block). The last block is decomposed into two parts related to the characteristics of individuals in the labor market and their sources of income. From the results generated by these three modules, we proceed to apply a detailed distributional analysis. In the following subsections, we briefly present the functioning of these three modules.
3.2.1. Price module
The module used to simulate the impact on the prices of all goods and services in the Moroccan economy, following the main price variations observed during the COVID-19 pandemic, is inspired by the Leontief model of prices.10 The latter involves the use of an input-output accounting framework. The model constructed uses producer prices (PP) and consumer prices (CP) of all goods considered (39 products, i.e. 78 endogenous variables) as endogenous variables. The exogenous variables on which shocks can be introduced are the wage rate, the rates of return on capital (one per industry), the trade margin rates on products, the transport margin rates on products, and the subsidy rates on products. All these exogenous variables are set at what was calculated at the base simulation without shock.
All parameters of this module are calibrated to 2015 ERT (employment resource table) data, the base year of the model. Both product price vectors are endogenous. The shocks introduced to obtain the price changes were applied to the trade margins, which were modified to generate the post-covid price changes, consistent with those provided by the HCP.11 By construction, the endogenous consumer price changes obtained capture and trace the direct and indirect effects associated with the simulated shocks.
3.2.2. Expenditure module
As stated, the other two modules are directly related to the EPM survey. To introduce the price changes generated by solving the sectoral model of the price block, it was first necessary to establish a correspondence between the nomenclature of products (nearly 1,300 items) considered by the EPM and the 39 products retained in the aggregation of the ERT of the price model. The total annual expenditure was deduced and we computed the associated budgetary shares of all product categories. These shares were then used to calculate idiosyncratic price indices by household following simulations. These indices are applied as deflators of total "nominal" household expenditures, computed after the application of income changes that result from the income block, the last block.
3.2.3. The income module
The latter module captures the characteristics of individuals in the labor market and their sources of income. We begin by deducting the income of each household member (from the 24 sources identified in the survey). We then calculate the total income of each household. It is in this module that we introduce the negative income shocks related to the pandemic and also some transfers received as a result of government interventions (actual and/or assumed). At the end of this module, we also compute the rates of change in income that are used to conduct the distributional analysis after the shocks. Figure schematically presents the model as a whole.
In addition to these three modules, the methodology is completed by the distributional analysis.
3.2.4. Distributional analysis
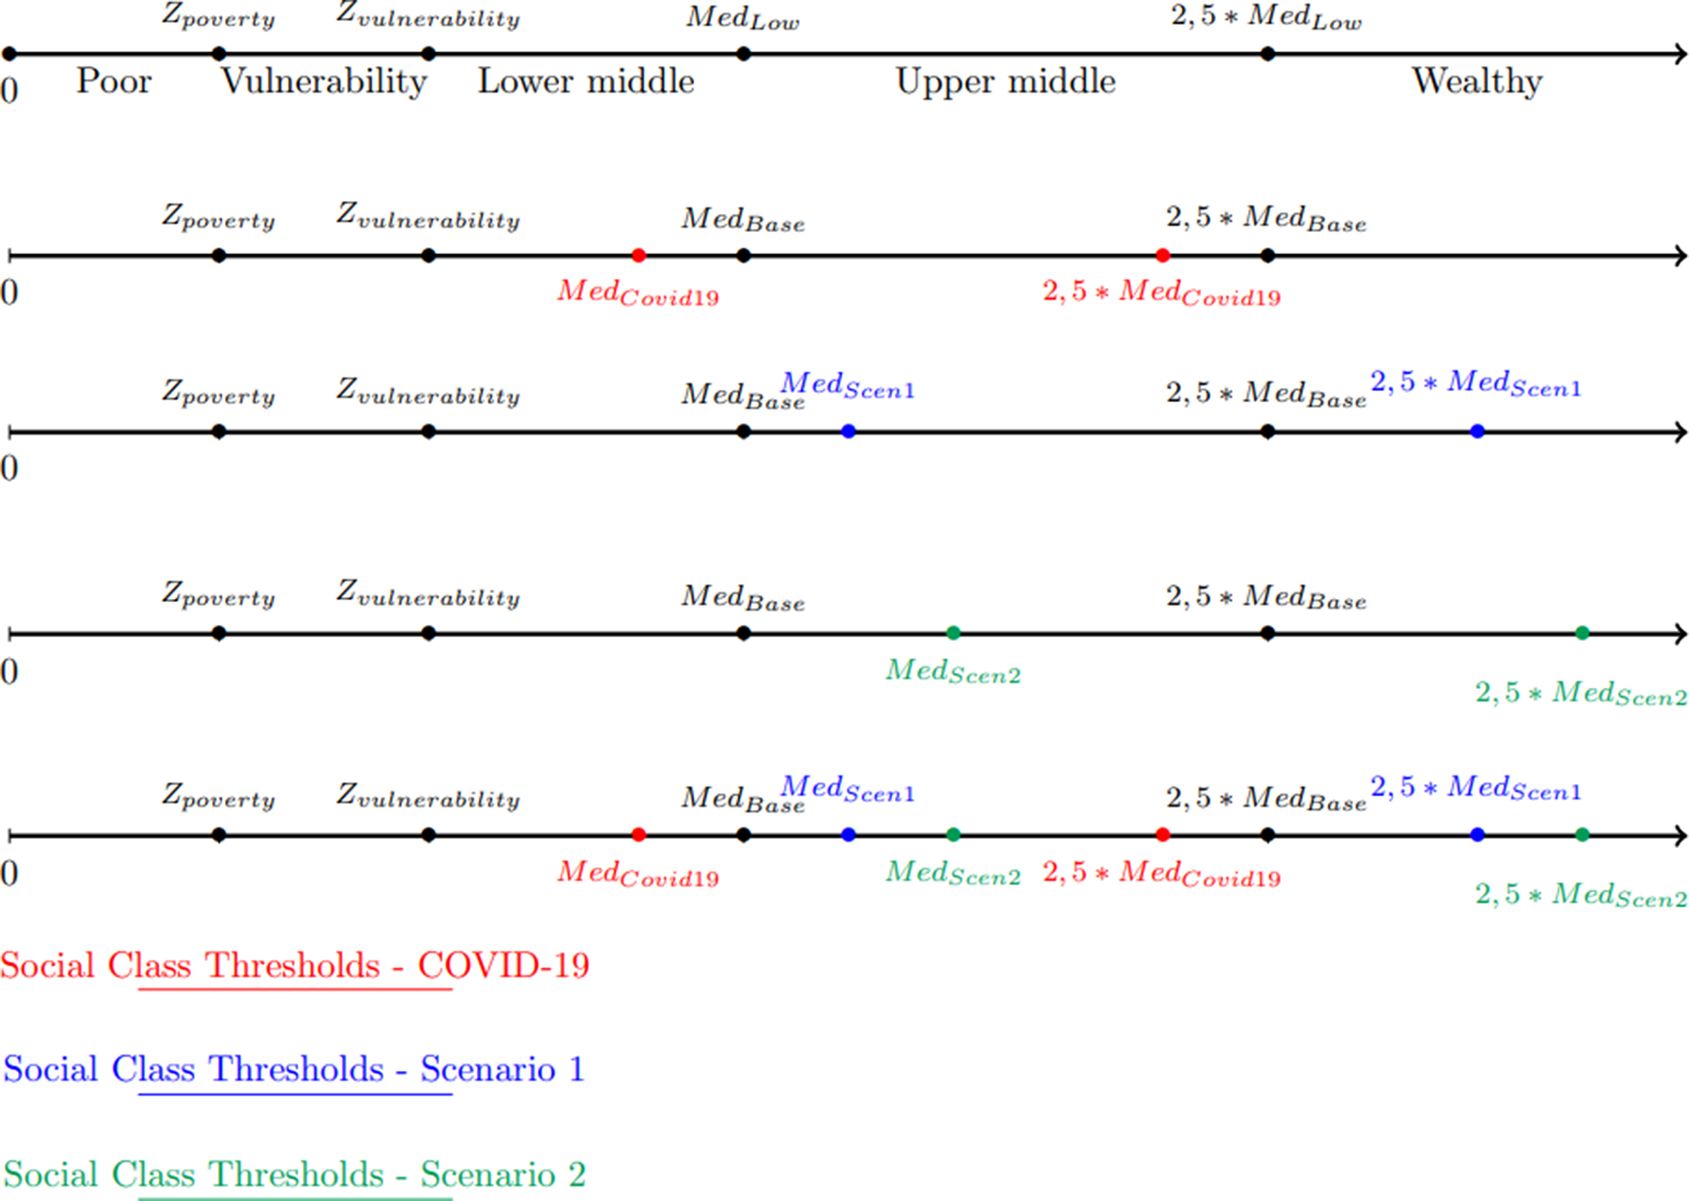
To begin our distributional analysis, we determined the average annual expenditure per capita for each household for the reference year, 2019. Then, to perform our analysis at the individual level on the one hand and at the level of children on the other, we retained a partition of the population into five classes (poor, vulnerable, low average (middle class), high average (middle class), wealthy) based on the average annual expenditure per capita in 2019. Thus, to ensure comparability with the other approaches by official national institutions, concerning the middle class (HCP approach using ONDH data), we have retained the following definitions:
The poor class is composed of households (individuals) that have a per capita expenditure below the national poverty line differentiated according to the area of residence (identified with Zpoverty) ;
The vulnerable class is composed of households (individuals) with a per capita expenditure above the poverty line (Zpoverty) but below the vulnerability threshold (Zvulnerability) associated and differentiated according to the area of residence. In our case, we use the recommended threshold of the World Bank, and hence, we use a vulnerability threshold equal to the poverty line plus 50% (Zvulnerability = 1,5x Zpoverty);12
The other three classes are lower middle, upper middle, and wealthy.13
This partition was repeated on the new vectors of average annual expenditure per capita adjusted after each scenario and for each area, with poverty lines (Zpoverty) and (Zvulnerability) constant and variable medians.14
To derive the vectors of average annual household expenditure under each of the three scenarios implemented, we applied the growth rates calculated on incomes at the end of the income module considering the following assumptions:
The rates of income change associated with the different simulations described in Figure 3 are fully reflected in the expenditures of poor, vulnerable, and other households in the database (in 2019). The assumption made here is therefore simply that the marginal savings of households in these three classes are zero;
We transmitted 50% of income variation in simulations (1 to 3) on the spending of the non-poor, vulnerable, and lower middle class. Our assumption implies that the expenditures of these households are not fully transferred given that they drew from their accumulated savings;
The expenditures of wealthy households are not affected at all, regardless of the change in their income. The hypothesis adopted here is that these households have sufficient savings or other sources of financing to absorb the shock and keep their consumption expenditure constant, at least in the short term.15
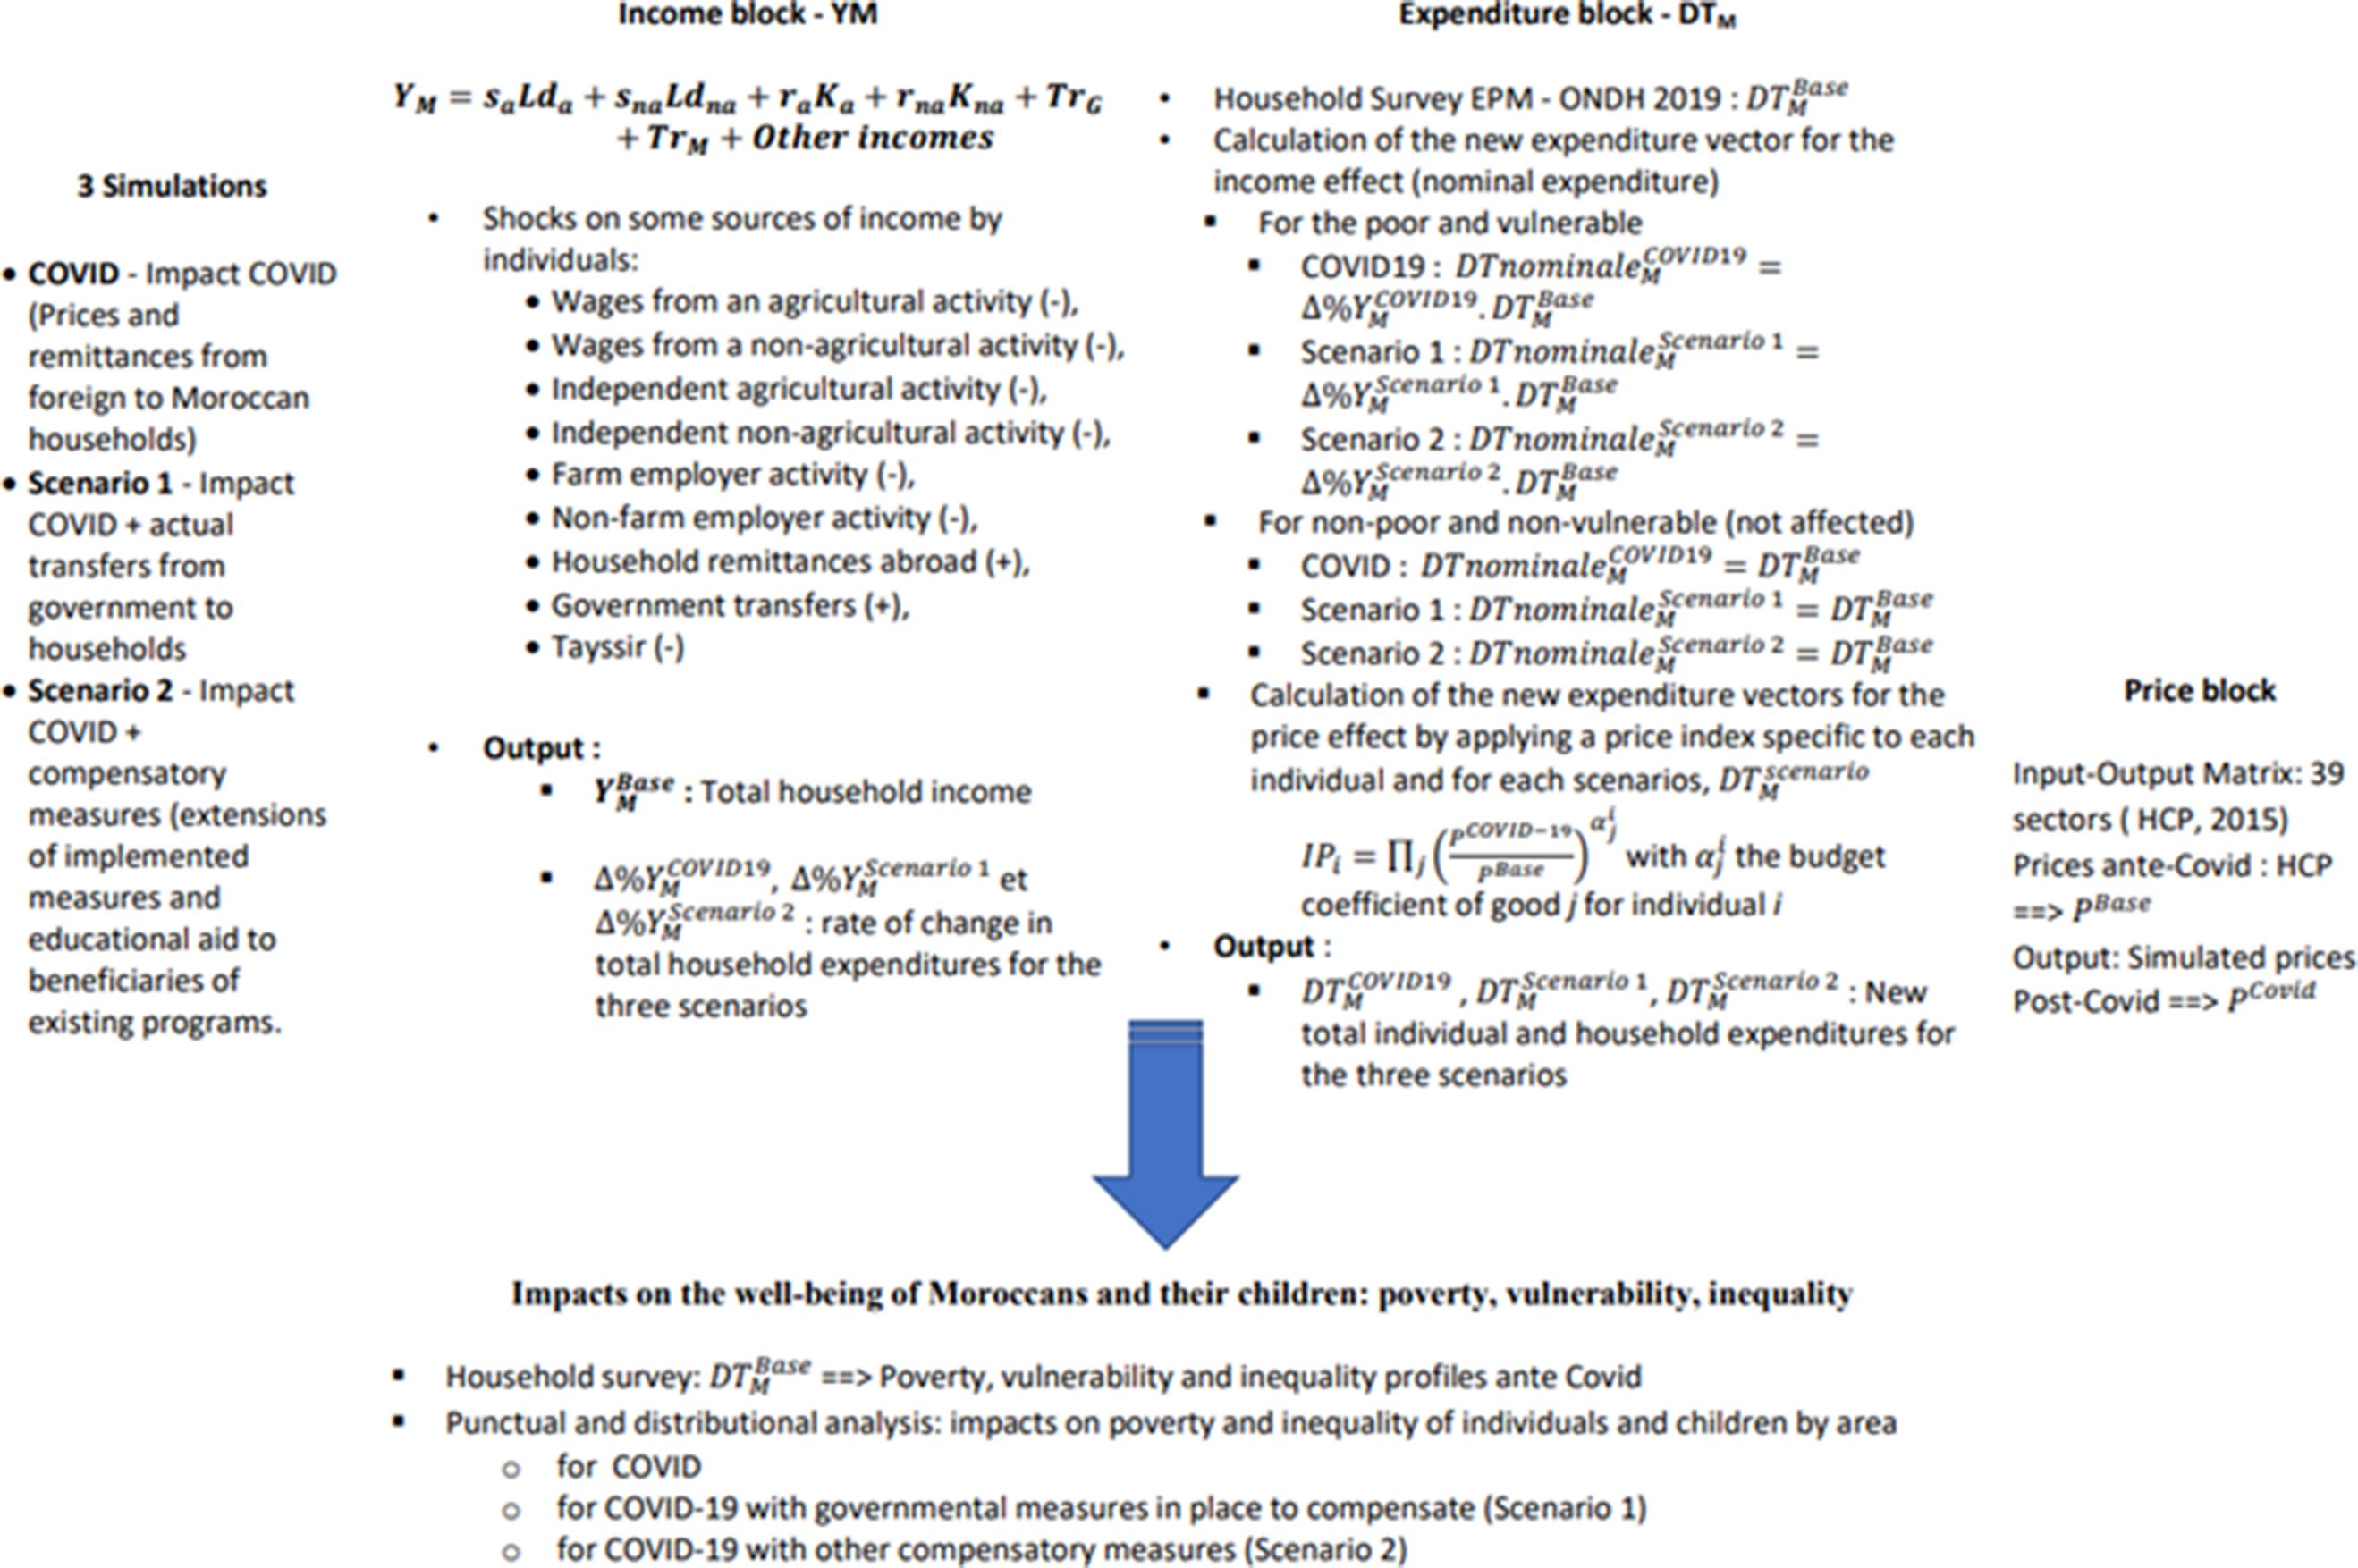
Synthesis of the model. Source: Authors.
Based on these assumptions, vectors of average annual (nominal) expenditure per household and per capita are derived. However, they cannot be used in this form to conduct poverty or distributional analyses, since they do not take into account price effects.
In our analysis, the adjustments were considered and applied according to the approach that relies primarily on the concept of equivalent income of (King, 1983).16 The resulting per capita expenditure is used to conduct poverty and vulnerability analyses with constant thresholds and different distributional analyses.
Indeed, based on these variables, all the usual measures of income poverty of the FGT (Foster et al., 1984) and inequality (Gini) are calculated, at the national level. Decompositions of these same measures, according to the place of residence in particular, or to bring out child poverty more specifically, have been produced. Incidence curves have also been constructed for cases taken in pairs and by area. These curves make it possible to highlight the winners and losers from one scenario to another.
3.3. The simulations
In this section, we present in detail the approach used to construct and implement the three simulations, which are broken down into a base case that we will call COVID, in which we simulate the impact of the crisis. Scenario 1 consists of applying the measures adopted by the government to mitigate the impact of the pandemic on households. Finally, scenario 2 consists of simulating complementary measures to further reduce the impact of the shock in addition to the measures put in place by the government. The three simulations are interrelated and complement each other sequentially (Cf. Figure 4).
Schematic representation of the simulations
To determine the impact of COVID-19 on Moroccan households (i.e., the base scenario applied to the micro-simulation model), we decomposed the impact into two components:
The impact on the prices of the household consumption basket and
The impact on revenues.
3.3.1. COVID-19 simulation
For the impact on prices, we first used data from the Haut-commissariat au plan (HCP) for price changes in March 2020.17 We used the largest price changes, namely the price of vegetables (+6.3%), fish and seafood (+1.9%), fruit (+1.7%), oils and fats (+0.4%), milk, cheese and eggs (+0.4%), and the fall in fuel prices (-6.8%). Since the price changes presented by the HCP concerned only 12 sectors and we had an input-output model with 39 sectors, we chose to exploit the three largest price changes, convert them according to our nomenclature, and apply these three price changes in the input-output model to generate 39 price changes. The 39 price changes obtained were then used as input in the micro-simulation model to vary the level of total household expenditure (price effect). Given the relatively small price variations obtained, this will not be the main transmission channel of the crisis.18
For the application of the income impact, we used the information collected by the Confédération générale des entreprises du Maroc (CGEM) (Confédération générale des entreprises du Maroc-CGEM, 2020) as part of its survey of the impact of COVID-19 on 1,740 companies in Morocco. This survey allowed us to approach the actual loss of profits and the loss of jobs by industry (31 industries) amid the crisis and containment. The investigators also asked the companies about their projected loss of profits for the year 2020. For example, a 50% loss of profits corresponds to a reduction in the activity of 6 months, so a worker in this sector will receive 50% of his or her salary income for the year 2020. To apply these variations at the level of the micro-simulated (MS) model, we mapped the 286 sectors of activity in the survey to these 31 branches in the survey. It should be noted that 76% of individuals are active in 10 industries.
In terms of transfers, we used different data and declarations from bank operators and remittance agencies from abroad to Moroccan households and we applied a homogeneous variation on the transfers received. As a result, we applied a uniform 50% reduction in transfers received from the rest of the world to all members receiving transfers in 2019 (baseline).
Thus, to determine the impact of income variations in the micro-simulation model, we exploited these variations and proceeded step by step. It should be noted that due to the richness of the survey used, the income variation is calculated at the level of individual household members and not at the household level. Aggregation is only done at the end of the process before moving on to household expenditure. We aggregate the income of each individual in the household to obtain the overall variation in household income that will be applied to the total household expenditure, depending on whether the individual is poor, vulnerable, middle class (low and high), or wealthy.
3.3.2. Government Actions - Scenario 1
In the context of the COVID scenario simulating the effect of the pandemic on households, in this scenario, we have essentially retained the measures that directly affect households as announced and implemented by the government.19
There are therefore two main measures put in place by the government to support households directly affected by the crisis.
For workers in the formal sector who are registered and identified with the Caisse Nationale de Sécurité Sociale (CNSS), the government decided to introduce a flat-rate allowance of 2,000 Dirhams (MAD) per month per worker. This measure concerned a little more than 900,000 workers who applied for and received this allowance. We have applied this payment for 3 and a half months.
For workers in the informal sector, there are two categories but they are subject to the same regime. The first category concerns workers who hold a medical insurance card (RAMED). The second category concerns workers who are not registered with this scheme. For these two categories, the lump-sum allowance is 800 Dirhams (MAD) per month for households of 2 persons or less, 1,000 Dirhams (MAD) for households of 3 to 4 persons, and 1,200 Dirhams (MAD) for households of 5 persons or more. In this category, about 1.5 million households received the allowance. We applied an average lump sum equivalent to 1,000 Dirhams (MAD) per household in this category and applied this measure for 4 months as planned in the program.
In total, according to the (Haut-Commissariat au Plan, 2020c) nearly 25% of households received benefits, which represents just over 1.8 million Moroccan households.
In the micro-simulation model, i.e., at the survey level, we identified and tracked members who could benefit from either government assistance. The basis of the identification was the variables type of activity (employed), whether or not they had a written work contract (a proxy for formal work), their occupational status (mainly salaried employees), and the sector of activity, so as not to consider government employees or public administration employees, because they were not affected by the crisis.
The changes in transfers from the rest of the world applied in the COVID-19 scenario are maintained as are the other assumptions and negative impacts on prices and incomes.
3.3.3. Complementary Measures - Scenario 2
To identify other measures, we first reviewed measures that have been implemented in other countries. What emerged from this review was that countries generally enhanced the support measures that were already in place in their country before the pandemic hit, trying to identify those that targeted the poorest and most vulnerable households. Finally, we considered the applicability of potential measures to be tested by excluding measures that would be unsustainably expensive for the government, although we did not explicitly assess the budgetary impact of the measures. In addition, the use of existing measures makes it easier for the government to implement these initiatives, and finally, we are constrained by the hypothesis and data in the model.
This process and the results of the HCP (2020c) report, led us to select two measures that were applied simultaneously in the micro-simulation model in conjunction with the COVID scenario and scenario 1. These measures are as follows:
Extending the payment of 2,000 Dirhams (MAD) per month for workers in the tourism sector until the end of 2020 (Morocco’s borders for tourists will likely be closed until the end of the year);
The extension by two months of aid payments to workers in the informal sector, both RAMedists, and non-RAMedists;
Based on a government mechanism already in place, we propose to provide assistance through the school system. The survey identifies six existing aid programs: the Tayssir program,20 the school canteen program, the public transportation program, the boarding school or dar talib, scholarships, and the 1 million de cartables program. In our scenario, all children between the ages of 5 and 17, who are already beneficiaries of at least one of these programs, will receive a lump sum of 100 Dirhams (MAD) per month for six months (from July to December) through their household. In addition to providing financial support to the household due to the crisis, this program aims to discourage school dropouts. This seems to us to be all the more important as the period of cessation will have been long (from March to September). This measure will therefore have an impact in the short term but also in the longer term if it allows, as we believe, to keep the children who benefit from the school program. From a budgetary point of view, the government could reallocate funds from the unused budgets of some of these programs during the lockdown (from March to June).
4. Results
In this section, after presenting the poverty and inequality analysis at the reference period, 2019, we present the impact of COVID-19 on poverty in Morocco and assess whether the measures taken by the government (scenario 1) and our designed measures (scenario 2) offset the negative effects caused by the pandemic. This analysis is conducted by distinguishing between urban and rural areas and children.
4.1. Poverty and Inequality in 2019
At the individual level, the average annual per capita expenditure of Moroccans is 18,769.68 MAD. As in the case of households, individuals living in urban areas have a higher average annual expenditure per capita (22,724.15 MAD) while individuals in rural areas have an average annual expenditure per capita more than 36% lower than the national average (12,069.16 MAD) (Table 4).
Average and median annual per capita expenditure of Moroccans (in MAD) in 2019
| Average | Median | |
|---|---|---|
| Morocco | 18 769.68 | 14 437.59 |
| Urban | 22 724.15 | 17 500.8 |
| Rural | 12 069.16 | 10 092.96 |
-
Source: Authors’ computation based on the ONDH - EPM (2019 wave).
To compute monetary measures of poverty, as is standard practice at the official level in Morocco, we used separate absolute poverty lines for urban and rural areas. We thus adjusted the official HCP thresholds used in the Enquête nationale sur la consommation et les dépenses des ménages (ENCDM) of 2013-2014 (Haut Commissariat au Plan, et Banque Mondiale, 2017) by applying the annual change in the consumer price index produced by the HCP between 2014 and 2019. Thus, the adjusted poverty lines used in this report are respectively 4,939.10 MAD per capita per year in the urban area and 4,563.40 MAD per capita per year in the rural area.
The Moroccan population is predominantly urban, with almost 2/3 of the population living in cities (62.89%). In 2019, according to data from the ONDH survey and the HCP’s official basic thresholds, Morocco has 1.19% of poor individuals, divided between 13.06% in the urban area and 86.94% in rural area, where the incidence of poverty is estimated at 2.79%. In terms of depth (FGT1) and severity (FGT2), rural areas are also more affected than urban areas Table 5.
Individual poverty rate (%) - 2019
| Share of pop. | FGT0 | Contribution FGT0 | FGT1 | Contribution FGT1 | FGT2 | Contribution FGT2 | |
|---|---|---|---|---|---|---|---|
| Morocco | 1.19 | 0.13 | 100.00 | 0.02 | 100.00 | ||
| Urban | 62.89 | 0.25 | 13.06 | 0.02 | 8.00 | 0.00 | 4.58 |
| Rural | 37.11 | 2.79 | 86.94 | 0.33 | 92.00 | 0.06 | 95.42 |
-
Source: Authors’ computation based on the ONDH - EPM (2019 wave).
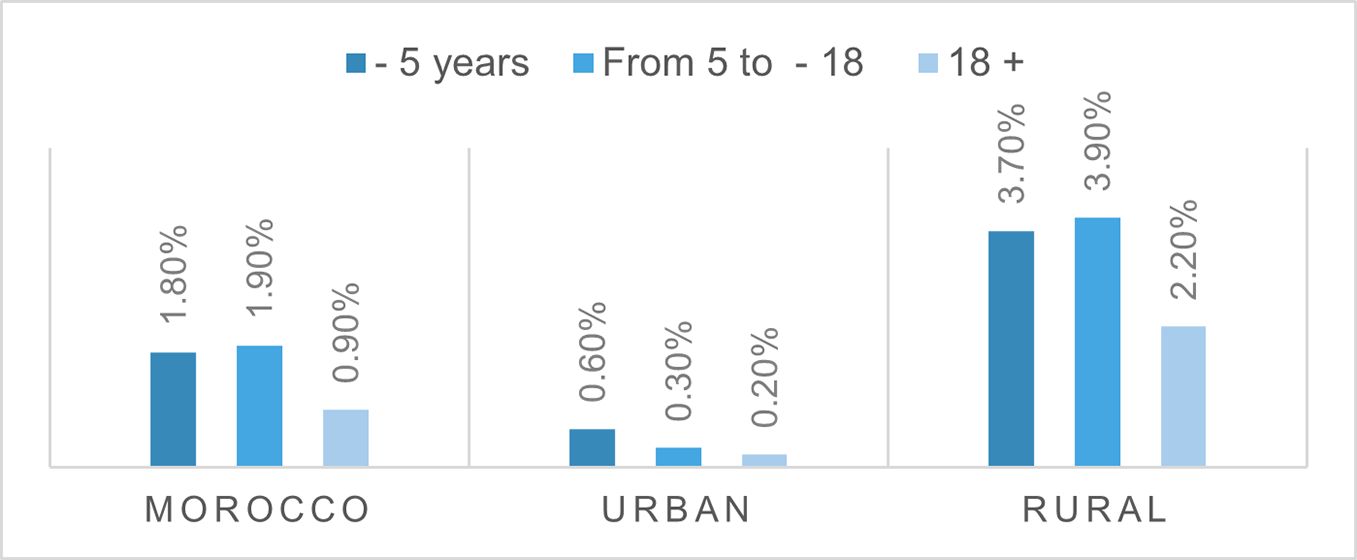
Since our objective is to approximate the impact of the pandemic on households and their children, we examined child poverty by distinguishing three groups: children under 5 years of age, those between 5 and 17 years of age, and individuals 18 years and older. From the data, 8% of the Moroccan population are children under the age of 5 and 23.2% are individuals between 5 and 17 years old. Thus, nearly one-third of the Kingdom’s population is under 18 years old.
In 2019, more than one million children under the age of 18 were poor in Morocco (1.03 million) and 24% of these poor children were under 5 years old (250,000). At the national level, 1.8% of children under the age of 5 are poor, contributing to the 12.5% national poverty rate. It is the group of children aged between 5 and 18 years old that has the highest poverty rate with nearly 2% of this population considered poor and contributing 36.1% to national poverty. Thus, nearly 50% of poverty in Morocco affects Moroccans under the age of 18 (Table 6).
Individual poverty rate 2019 - by age group
| Poverty incidence | |||
|---|---|---|---|
| Share in the population | FGT0 | Contribution to FGT0 | |
| Morocco | 100% | 1.19% | 100% |
| - 5 Years | 8.2% | 1.8% | 12.5% |
| + 5 to - 18 Years | 23.2% | 1.9% | 36.1% |
| 18 and + | 68.6% | 0.9% | 51.4% |
-
Source: Authors’ computation based on the ONDH - EPM (2019 wave).
When we break down this distribution of poverty by age group, considering urban and rural areas, we find that the poverty incidence among young people under 18 is higher in rural areas than in urban areas (Figure 5). Thus, the poverty rate for youth in the rural area is higher than the poverty rate observed at the national level for this environment. This is because there are more poor people in the rural area and rural households are also larger on average.

Incidence of poverty by age group and place of residence
Then Figure 6 presents the Gini inequality indices for Morocco and rural and urban areas in 2019. Not surprisingly, we observe higher inequality in urban areas compared to rural areas (0.347 versus 0.280). Urban inequality is also lower than that of the country (0.361).
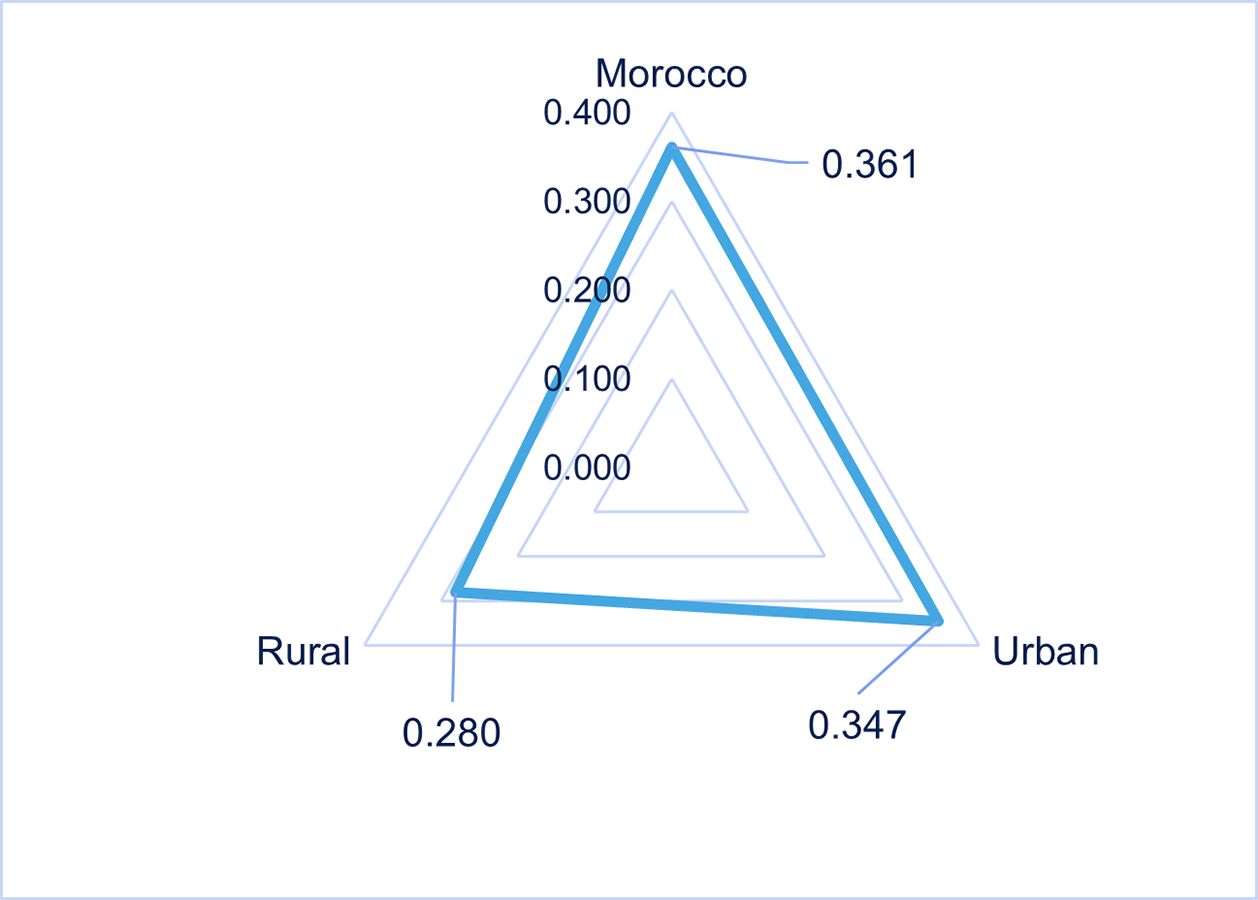
Gini index – 2019. Source: Authors’ computation based on the ONDH - EPM (2019 wave).
4.2. Effects of COVID-19 and Mitigation Measures
Table 7 reports the incidence of poverty and vulnerability in Morocco decomposed for urban and rural areas, following the simulated COVID-19 shock and the implementation of mitigation measures (scenario 1 and scenario 2).
Incidence of poverty and vulnerability by place of residence and scenarios
| Poor (FGT0) | Vulnerable | ||
|---|---|---|---|
| Base | Urban | 0.2% | 2.8% |
| Rural | 2.8% | 15.1% | |
| Morocco | 1.2% | 7.4% | |
| COVID | Urban | 5.5% | 5.6% |
| Rural | 9.9% | 17.0% | |
| Morocco | 7.2% | 9.8% | |
| Scenario 1 | Urban | 2.4% | 5.4% |
| Rural | 5.1% | 10.9% | |
| Morocco | 3.4% | 7.4% | |
| Scenario 2 | Urban | 1.4% | 4.7% |
| Rural | 3.2% | 9.3% | |
| Morocco | 2.1% | 6.4% |
-
Source: Authors’ computation based on the ONDH - EPM (2019 wave).
In terms of poverty incidence, our results confirm the negative impact of COVID-19. Indeed, poverty among Moroccans increases by 6 percentage points. The finding is that individuals in urban areas are the most affected by this shock in terms of percentage change in poverty incidence. This is explained by the cessation of economic activities and, as explained above, by the partial or total loss of income for some Moroccans.
Although the shock appears to be smaller for rural dwellers, the poverty rate increased by 7.1 percentage points. Thus, the pandemic has affected urban Moroccans to a greater extent, but the number of poor people in rural areas, where we observed a higher incidence of poverty in 2019, has also increased significantly. This corroborates the findings of the UNDP report on the impact of the pandemic (United Nations Development, 2020).
Our results also highlight that the aid quickly put in place by the government (scenario 1) had a positive effect in attenuating the shock, since the incidence of poverty in urban areas fell and was 2.2 percentage points higher than in 2019. The effect in the rural area is also positive, with the incidence going from 9.9 to 5.1%.
Scenario 2, which complements the government’s income support measures, targets workers in the informal sector as well as those working in the tourism sector. This scenario has a positive effect on urban individuals as the incidence of poverty decreases to around 1.4 percent. Another measure introduced in scenario 2 targeted rural households by providing an allowance for households with children under certain conditions related to schooling. The impact of this measure is to practically absorb the negative effects of COVID-19 shock on poverty.
The effects on vulnerability are in the same direction, with an increase of 2.4 percentage points following the COVID-19 shock at the national level. This confirms the fact that the pandemic has pushed part of the Moroccan population into poverty and vulnerability. The government’s measures partially offset this negative effect, but we highlight that part of the population that was vulnerable before COVID remained in poverty despite the measures.
In terms of inequality, Figure 7 shows that the pandemic has increased inequality in both urban and rural areas. This is coherent with the findings of (Gerzon Mahler et al., 2020) on the distributive impact of the pandemic.
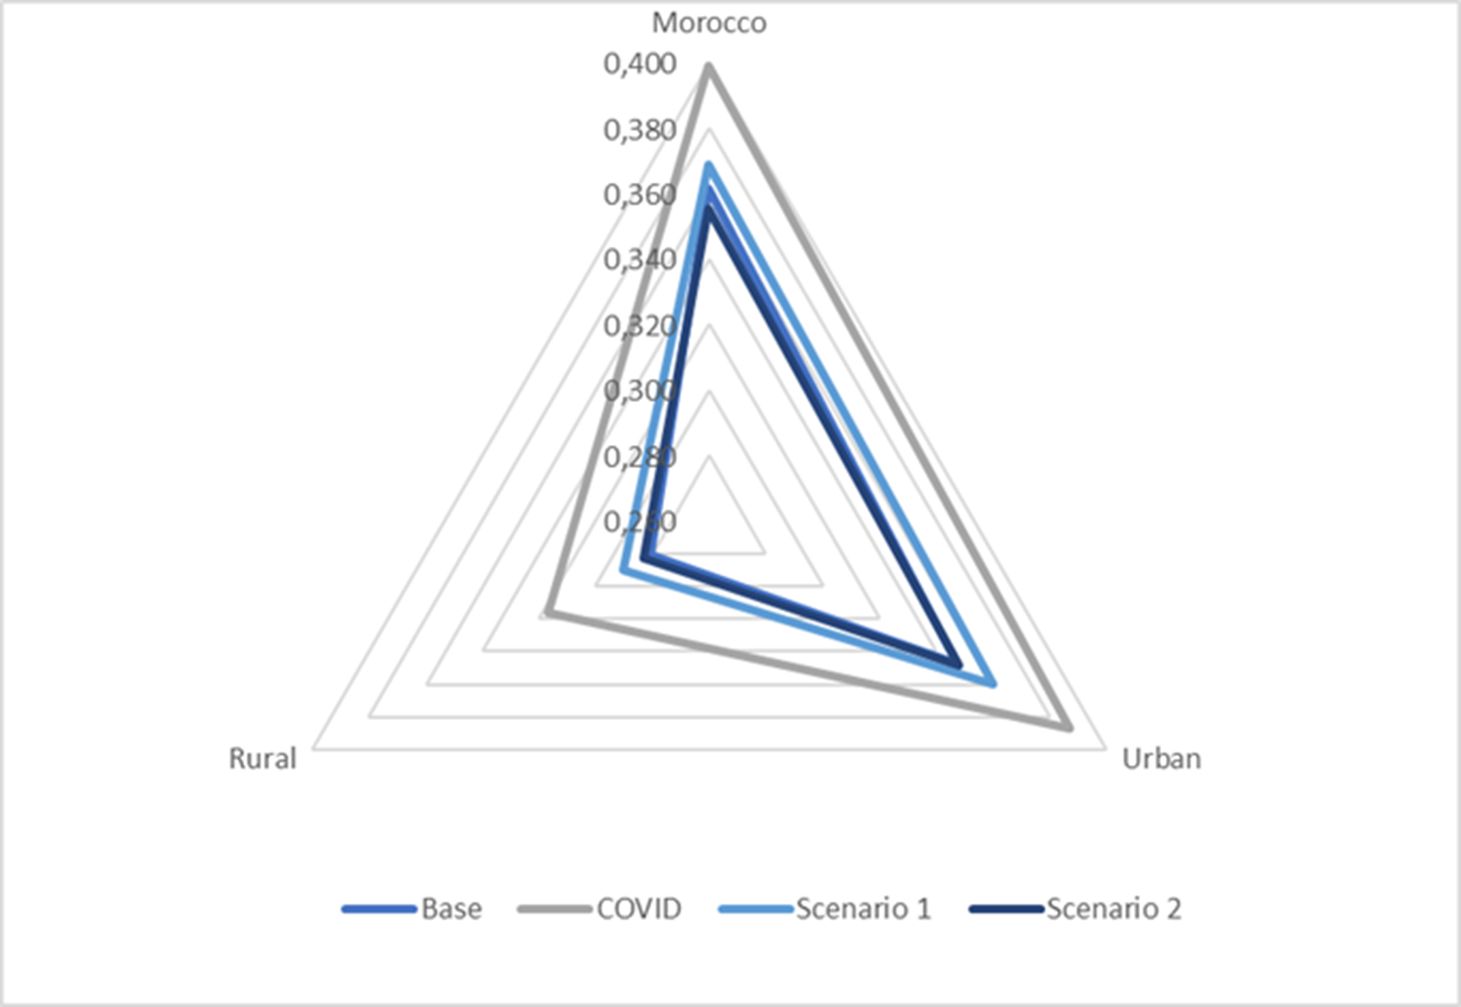

Gini index by place of residence and scenarios
As expected, the general shapes of the density function curves, based on the area of residence (urban and rural), are generally the same. However, the curve for average per capita expenditure during the pandemic shifted sharply to the left, regardless of their location of residence, confirming the shift of a portion of the population towards the vulnerable and poor classes (Figure 8).
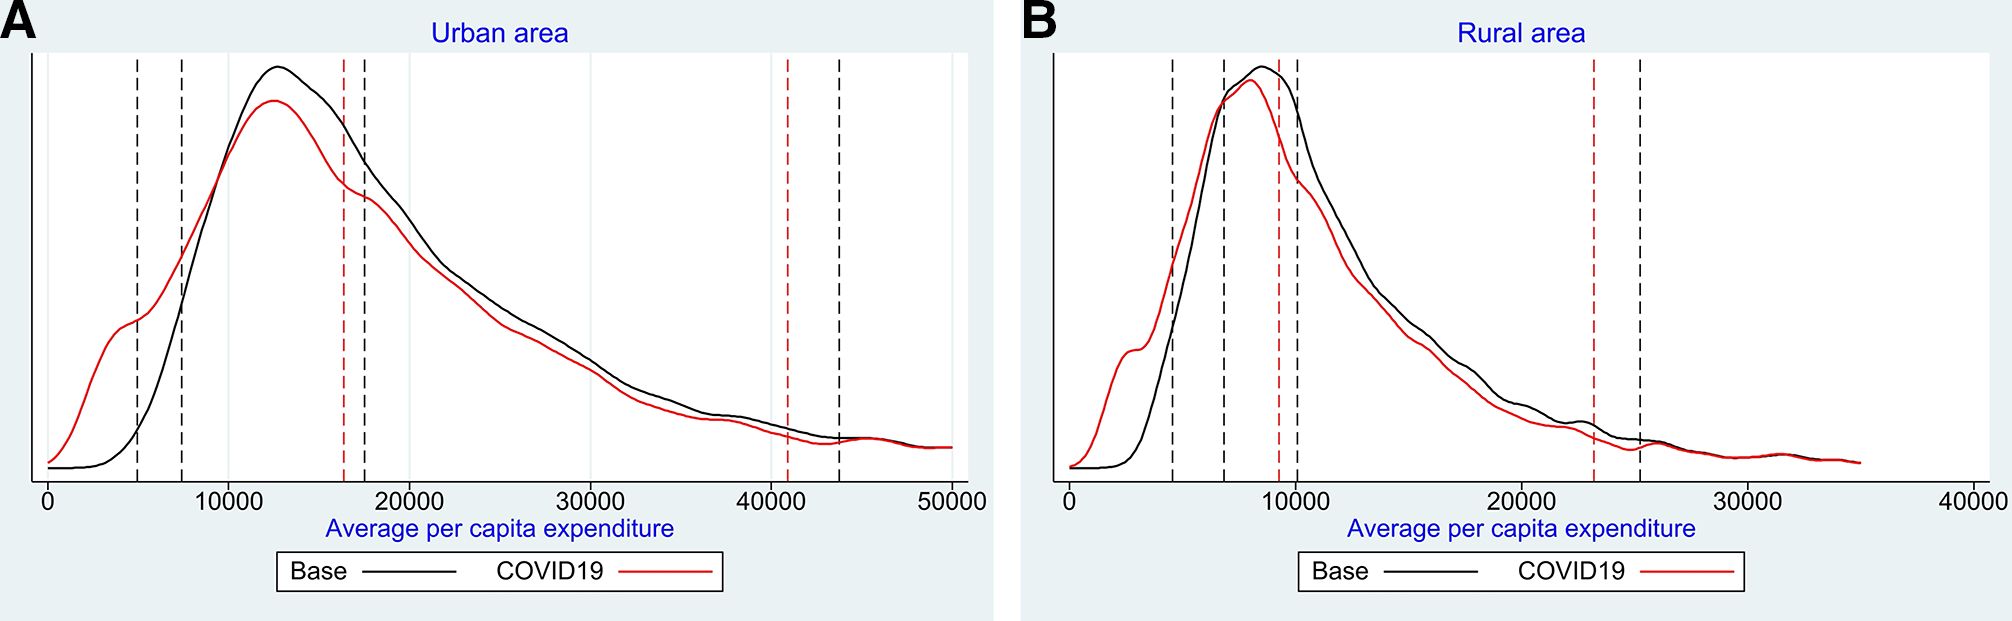
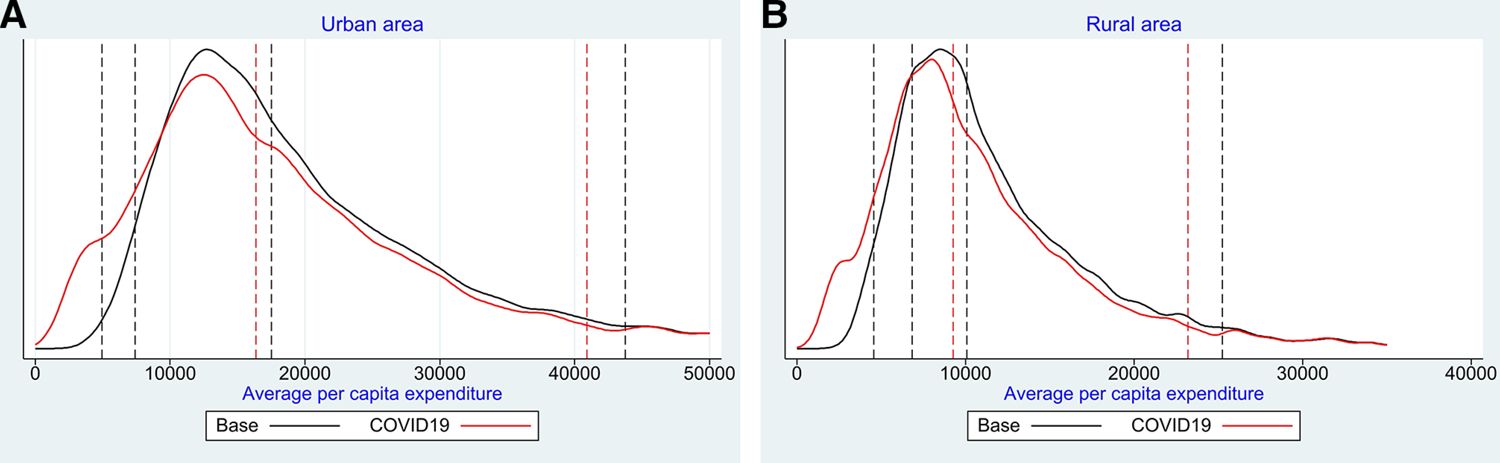
Average per capita expenditure density curves - Reference and COVID 19. Source: Authors’ computation based on the ONDH - EPM (2019 wave),Note: The vertical lines are the poverty line, the vulnerability line, the median, and 2.5 times the median respectively.
To show the combined effect of the negative shock of the pandemic and the different measures simulated, we analyze the shift of the density curves of the baseline situation with those obtained under scenario 2 (Figure 9).21
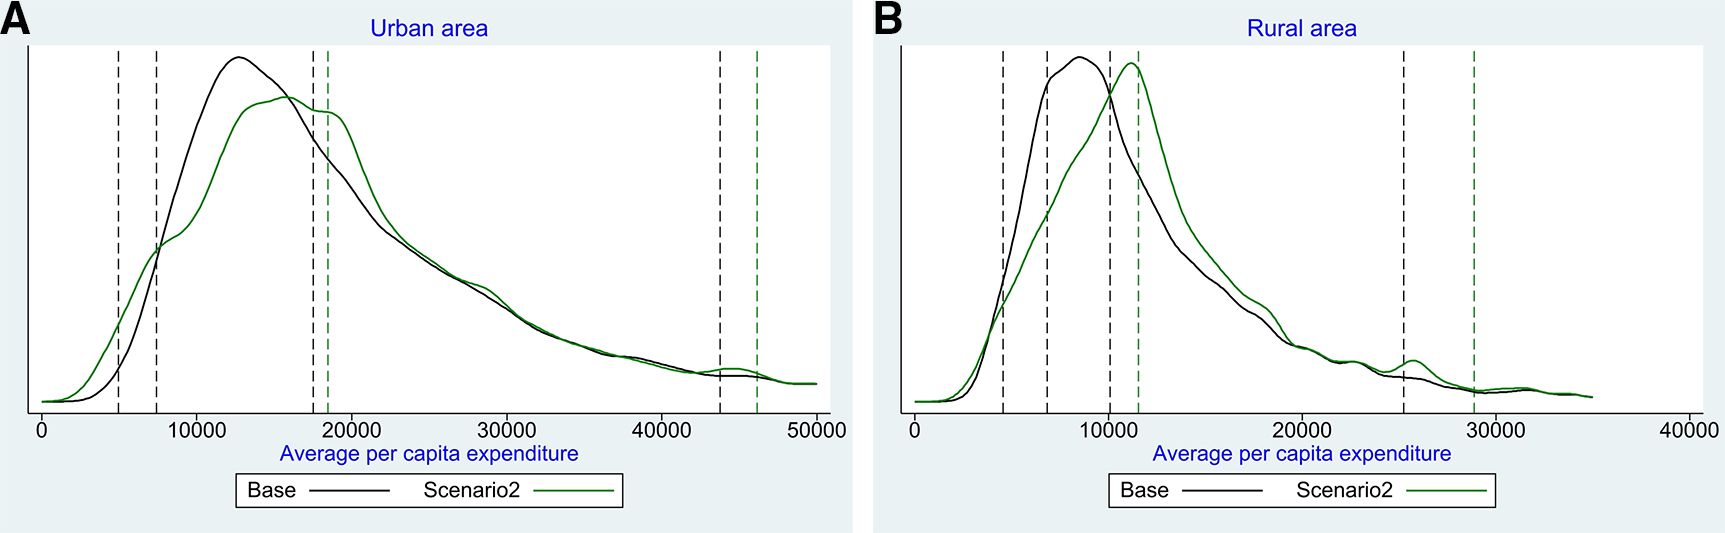
Density curves of the average expenditure per capita at the base and under scenario 2.. Source: Authors’ computation based on the ONDH - EPM (2019 wave).Note: The vertical lines are the poverty line, the vulnerability line, the median, and 2.5 times the median respectively.
For the rural population, the policies put in place, in addition to those we have identified and simulated, are likely to neutralize most of the negative effects of the shock on the poor and vulnerable classes. For the urban group, some individuals persist in poverty, which can be explained by the fact that the shock was more profound and since the additional mitigation policies proposed are likely to benefit poor and vulnerable rural households by their nature or design. This finding is the same as that obtained with the poverty and Gini indices.
To illustrate the effects of the shock and the mitigation measures, we plot the incidence curves (CI).22 These curves allow us to verify the "pro-poor" character of shocks and measures. Figure 10 depicts the incidence curves on per capita spending between the baseline situation and the three scenarios for rural and urban. This analysis shows that the poorest percentiles are the most affected by the pandemic and remain so compared to the pre-crisis situation, despite the government’s measures and our proposed measures.

Incidence curves on per capita spending between the base situation and scenarios. Source: Authors’ computation based on the ONDH - EPM (2019 wave).
For percentiles below 50% (p < 50%), the values of the incidence curve (noted g(p)), are negative while these values are always negative but less for the other percentiles. It is therefore clear that households in the poor and vulnerable classes of the population were the most affected, regardless of the place of residence. In the urban area, the workers are generally active in the private sector and especially in the informal sector. They obtain their income from activities that were negatively impacted by the cessation of economic activities or by the lockdown. Therefore, we observe a general deterioration in the population’s standard of living as measured by average household expenditure per capita, although the decline is very slight for the top 5% of the distribution. Moreover, despite the aid put in place or proposed in favor of the most disadvantaged classes, the overall impact of the pandemic and the interventions was not "pro-poor" in the sense (Ravallion and Chen, 2003), even with very high rates of growth in the median and average per capita expenditure (14.41% and 10.93% respectively).
Now, as our objective is to study the impact of the pandemic on children, based on the age group decomposition presented above, we look at how the poverty and vulnerability indices vary (Table 8). It appears that it is those in urban areas who are most affected by the pandemic. While the poverty rate for children under 5 years of age was 0.6% in 2019, it rose to 8.9%. Thus, nearly 150,000 children under the age of 5 would have been pushed into poverty because of the pandemic. For the group aged 5 to 17, it is 108,500 additional individuals living in poverty in the urban area. These children belong to families where some members have seen their income drop in whole or in part, children are directly affected by these drops in their parents' resources.
Incidence of poverty by age group (%) and area of residence
| Base | COVID-19 | Scenario 1 | Scenario 2 | ||
|---|---|---|---|---|---|
| Poverty | |||||
| Morocco | - 5 years | 1.8 | 10.1 | 5.1 | 3.2 |
| From 5 to - 18 | 1.9 | 9.9 | 5.1 | 3.1 | |
| 18 and + Years | 0.9 | 5.9 | 2.6 | 1.6 | |
| Urban | - 5 years | 0.6 | 8.9 | 3.9 | 2.4 |
| From 5 to - 18 | 0.3 | 7.8 | 3.9 | 2.3 | |
| 18 and + Years | 0.2 | 4.5 | 1.8 | 1.1 | |
| Rural | - 5 years | 3.7 | 11.8 | 7.0 | 4.5 |
| From 5 to - 18 | 3.9 | 12.7 | 6.6 | 4.1 | |
| 18 and + Years | 2.2 | 8.4 | 4.2 | 2.7 | |
| Vulnerability | |||||
| Morocco | - 5 years | 11.4 | 22.5 | 14.7 | 11.4 |
| From 5 to - 18 | 12.7 | 23.2 | 15.3 | 12.0 | |
| 18 and + Years | 6.8 | 14.3 | 8.8 | 7.0 | |
| Urban | - 5 years | 4.4 | 16.0 | 11.4 | 9.2 |
| From 5 to - 18 | 4.6 | 15.5 | 11.1 | 8.9 | |
| 18 and + Years | 2.5 | 9.4 | 6.4 | 5.0 | |
| Rural | - 5 years | 22.0 | 32.1 | 19.7 | 14.9 |
| From 5 to - 18 | 23.3 | 33.5 | 20.7 | 16.1 | |
| 18 and + Years | 15.0 | 23.3 | 13.5 | 10.7 | |
-
Source: Authors’ computation based on the ONDH - EPM (2019 wave).
In the rural area, where the poverty rate is estimated at 2.79% in 2019, the incidence of poverty among children under 5 has increased from 3.70% (approximately 43,000 children) to 11.80%, representing nearly 140,000 children. Thus, the pandemic would have driven nearly additional 96,000 children under the age of 5 into poverty in the rural area. For group 5 to 18, nearly 200,000 individuals living in the rural area are poor, whereas they were not poor in 2019. Thus, more than half a million Moroccan children under the age of 18 would have fallen into poverty because of the pandemic.
As expected, we find that the transfers offered by the government to compensate for the loss of household income due to confinement partially offset the effect of COVID-19 for Moroccan children under 5 years of age and those aged 5 to 18 years. These offsetting effects are observed in both urban and rural areas. However, our complementary measures (scenario 2) targeting rural households with a cash transfer to compensate parents for the loss of education-related assistance and the additional costs of children not attending school since mid-March results in a larger decline in poverty among rural children. As a result, the increase in poverty among children under 18 is reduced by almost 60% because of complementary measures.
When we look at the incidence of vulnerability by age group, we find that young Moroccans under 18 are almost twice as vulnerable as their elders. In terms of the effect of the pandemic, we find that the shock was stronger in the urban area. The compensatory measures simulated in scenarios 1 and 2 are still playing their role here, with the incidence rates of vulnerability decreasing to their initial rate for children under 5 years of age and decreasing very slightly for young people aged 5 to 17 years at the level of Morocco. When we distinguish the effects of the measures by area of residence and age group, we find positive effects in both areas and for all age groups. However, while in the rural area the proportion of vulnerable youth under 18 decreases relative to the baseline situation, in urban areas this proportion remains much higher despite the compensatory measures.
We also evaluated the contribution of the components associated with our scenarios to the variation in the poverty and Gini indices between the baseline situation and the results obtained with scenario 2. By construction, our scenarios combine five components that are added to the baseline situation in terms of per capita expenditure. Our five components are 1- the nominal effect associated with the pandemic (covid); 2- the nominal effect of simulation 1 in which some individuals received transfers (scenario 1); 3- the nominal effect of the extension of transfer payments that we propose for workers in the tourism sector and workers in the informal sector (scenario 2 – no school aid); 4- the nominal effect of the payment of school aid to each child who is already a beneficiary of an aid program (school aid); and finally 5- the price effect (deflator). We computed these contributions by place of residence(Figure 11) but also for children under 18 years of age (still by place – Figure 12).

Contribution of the components to the total variation of the indices.23 (A) Urban (B) Rural.. Source: Authors’ computation based on the ONDH - EPM (2019 wave).

Contribution of the components to the total change in the indices for children under 18. (A) Urban (B) Rural.. Source: Authors’ computation based on the ONDH - EPM (2019 wave).
As we have already seen, the contribution of the pandemic is negative for all groups and indices. The measures implemented by the government partially offset this negative effect. However, this decomposition allows us to conclude that the variation in prices observed in Morocco had no significant effect on the variation in the poverty and inequality indices. Also, the negative effect of the pandemic is due mainly to the partial or total loss of income for some people and to the decrease in transfers received from households living abroad.
By breaking down scenario 2 into two (government transfer effect and school aid effect), we see that their contribution differs according to the area of residence. Indeed, while scenario 2 without school, transfers has a positive contribution to the reduction of poverty and inequality in the urban area, we find that this effect is negative in the rural area. This could be explained by the fact that Moroccans living in rural areas do not benefit from the complementary transfers that we designed. Finally, the contribution of school aid is positive for both groups (urban and rural), but with a greater contribution to poverty reduction in rural areas since this measure essentially targets this poor population.
When we perform the same analysis restricted to children under 18, we obtain similar results. Thus, the price effect has no significant impact on the variation in poverty and inequality (Figure 12). The COVID effect helps explain a large part of the variation in the indices among children. This negative contribution is stronger for children in the rural area. A final difference that we observe when we target children is that the contribution of school aid to reducing poverty and inequality is stronger in rural areas than in urban areas, but it remains below the contribution we obtained when we considered the entire Moroccan population. Thus, even though the measure targets children between the ages of 5 and 17, the effects of this measure are felt by the households in which these children live.
Finally, we analyze the cost of scenario 2 in its entirety and isolate the school aid provided in this scenario. Scenario 2 complementary measures would cost the government nearly 173 million MAD, representing a per capita cost of 4.86 MAD, or 6.33 MAD per beneficiary (Table 9). Finally, this scenario has a cost equal to 789.86 MAD per child under the age of 18 who is lifted out of poverty thanks to these measures.
Cost-effectiveness of scenario 2
| The total cost of the measure - MAD | Cost per capita (total population) - MAD | Cost per capita (beneficiary population) - MAD | Per capita cost per child under 18 out of poverty - MAD | ||
|---|---|---|---|---|---|
| Scenario 2 complete | Morocco | 172 900 000 | 4.86 | 6.33 | 789.87 |
| Urban | 78 186 400 | 3.50 | 5.06 | 768.2 | |
| Rural | 94 713 000 | 7.17 | 7.97 | 808.69 | |
| Scenario 2 School Aid | Morocco | 20 615 400 | 0.58 | 2.12 | 94.18 |
| Urban | 5 954 400 | 0.27 | 1.41 | 58.50 | |
| Rural | 14 661 000 | 1.11 | 2.67 | 125.18 |
-
Source: Authors’ computation based on the ONDH - EPM (2019 wave).
When we compare rural and urban areas, we find that 55% of the cost of the full scenario 2 falls on rural areas. However, even though the per capita cost is more than double in the rural area (7.17 MAD versus 3.50 MAD in urban areas), the cost per child out of poverty with this measure is only 5% higher in the rural area. We have done the same analysis by isolating the effect of the school aid provided in scenario 2. The total cost of this measure amounts to 20.62 million Dirhams, or 0.58 MAD per Moroccan and 2.12 MAD per beneficiary of the measure. This measure, which targets children, would cost almost 100 MAD (94.18 MAD) per child lifted out of poverty by scenario 2. As these programs are mainly implemented in rural areas, more than 71% of the cost of this measure is allocated to them. This school aid program would thus cost 125.18 MAD per child lifted out of poverty with scenario 2.
We find that the school aid measure has a low marginal cost when spread over the entire Moroccan population and that its contribution to poverty reduction, particularly among rural children, is significant. Thus, a measure of this nature could easily be considered, especially since we believe that it could have long-term effects by encouraging households receiving this allowance to send their children back to school.
5. Conclusion
The COVID-19 pandemic had significant economic and social impacts around the world. Intuitively, the poorest and most vulnerable households are likely to bear the greatest burden of this crisis. In addition, the short-term impact on children could lead to long-term negative effects (nutrition, education, etc.). It is likely that the efforts made over the past several years to reduce poverty in general, and child poverty in particular, have been greatly diminished.
In this study, we built a micro-simulation model using raw data from the 2019 ONDH Morocco EPM to assess the distributional impact of the COVID-19 crisis on Moroccan households and children in particular. Our model allowed us to design and simulate very targeted measures. Hence, we analyzed the distributional effects of the government’s early mitigation policies and some additional measures to further reduce the negative effects on Moroccan children.
We assess the impact of COVID-19 on poverty and vulnerability in Morocco with a focus on children living in poor households. The design of the COVID-19 reference scenario was based on the maximum available information amid the first wave of the pandemic and after two months of strict lockdown. To fully capture the effects of the crisis and mitigation measures, we selected several tools, indices, and graphs from the distributional analysis. Our results clearly show that the crisis has led to a fairly significant increase in poverty, with more pronounced effects in the urban area. When we broaden our analysis in terms of vulnerability, we observe that even though before the pandemic, more rural households were vulnerable, COVID-19 had a greater impact on urban households. Children under 5 years of age and young adults (over 18 years of age) are the most affected.
The mitigation measures put in place by the government and that we simulated were relatively effective in that they reduced the negative impact on poverty at the national level and in urban areas by half, and slightly less than half in the rural area. The additional measures we have designed further reduce the negative impact of the pandemic. In addition, as a result of these measures, the number of vulnerable rural people has decreased in both rural and urban areas. However, the two scenarios do not compensate for the shock of the pandemic in the urban area as opposed to the rural area. When we focus our analysis by age category, the incidence rates of vulnerability decrease to their initial rates for children under 5 years of age and decrease very slightly for youth aged 5 to 17 years at the national level. However, we find that this vulnerability is deeper and more severe even after the implementation of compensatory measures.
Inequalities have increased as a result of the pandemic. The measures put in place by the government reduced inequalities at the national level and in rural and urban areas. The measures we designed to reinforce this decrease in inequalities at the national level and bring those in urban and rural areas back to their initial level of inequality.
The analysis of the impact on children shows that the negative impact is greater than for the general population and that children under the age of 5 would be the most penalized. Just over half a million children under the age of 18 would fall into poverty as a result of the pandemic. The government’s measures (scenario 1) and the additional ones we designed would be effective in reducing the negative impact of the pandemic. It is also important to note that the crisis has a stronger impact on rural children and the measures adopted would be less effective in rural areas than in urban areas.
Our calculation of the cost of the policies in scenario 2 allows us to measure the cost efficiency of the measures. These calculations reveal that school aid has a relatively low cost when spread over the entire population, but that its contribution to poverty reduction, particularly among children in rural areas, is significant. This measure is all the more interesting as it could have long-term effects by encouraging households to keep or send their children to school.
Given that a large part of the shocks of the pandemic directly affects income, and to better understand their impact and the effectiveness of compensatory measures, it would be interesting to improve the transmission of these shocks to expenditure. A different method than the ad hoc one used in this article could therefore be developed.
Given the negative impact of the pandemic on child poverty and the positive effects of the various measures, it would be interesting for the government and development partners to maintain certain measures for a prolonged period as the negative impact of the pandemic could have a long-term and lasting negative impact on Moroccan children. From this point of view, a multidimensional analysis might be developed to approach these medium- and long-term impacts, particularly on child poverty, which is a population that is strongly affected by this pandemic.
Footnotes
1.
2.
3.
Ahmed Lahlimi (High Commissioner for Planning) to EFE: Morocco should record its worst economic year of the century, by Rahim Sefrioui on 14/04/2020 at 12:11 (updated on 14/04/2020 at 12:19 and https://www.hcp.ma/file/216987/.
4.
This survey was conducted by telephone between April 1 and 3, 2020 among 4,000 companies operating in the manufacturing, construction, energy, mining, fishing, trade and non-financial market services sectors.
5.
In fact, this negative impact did not materialize. In fact, transfers increased to 68,2 billions dirhams in 2020 reprsenting a 4,9% increase (Office des changes 2021: Indicateur Mensuels des échanges extérieurs, OC-Maroc décembre 2021).
6.
7.
No other estimate of poverty impact of COVID has been produced in Morocco to our knowledge.
8.
In this sense, the ONDH has sent us 11 raw sub-files of this survey for the 2019 wave (without any processing carried out on the base). All our processing was carried out on the basis of these raw files.
9.
In some of the treatments carried out in this work, the numbers appear slightly different from what is expected. Indeed, we did not impute any missing data in the different files.
10.
For more details on this type of model, see (Miller and Blair, 2009), (Kamionkowski et al., 1995) and (Chowdhury and Kirkpatrick, 1994).
11.
See the Haut-commissariat au plan’s information note on the consumer price index (CPI) for March 2020.
12.
The vulnerability analysis was conducted by considering all individuals below the vulnerability threshold. Thus, the figures obtained are the cumulative number of poverty and people in the vulnerable class.
13.
A lower middle class composed of households (individuals) that have a per capita expenditure above the vulnerability threshold (Zvulnarability) but below the median of the distribution; An upper middle class composed of households (individuals) with a per capita expenditure above the median of the distribution but below 2.5 times this median. The wealthy class is composed of households (individuals) with a per capita expenditure greater than 2.5 times the median of the distribution.
14.
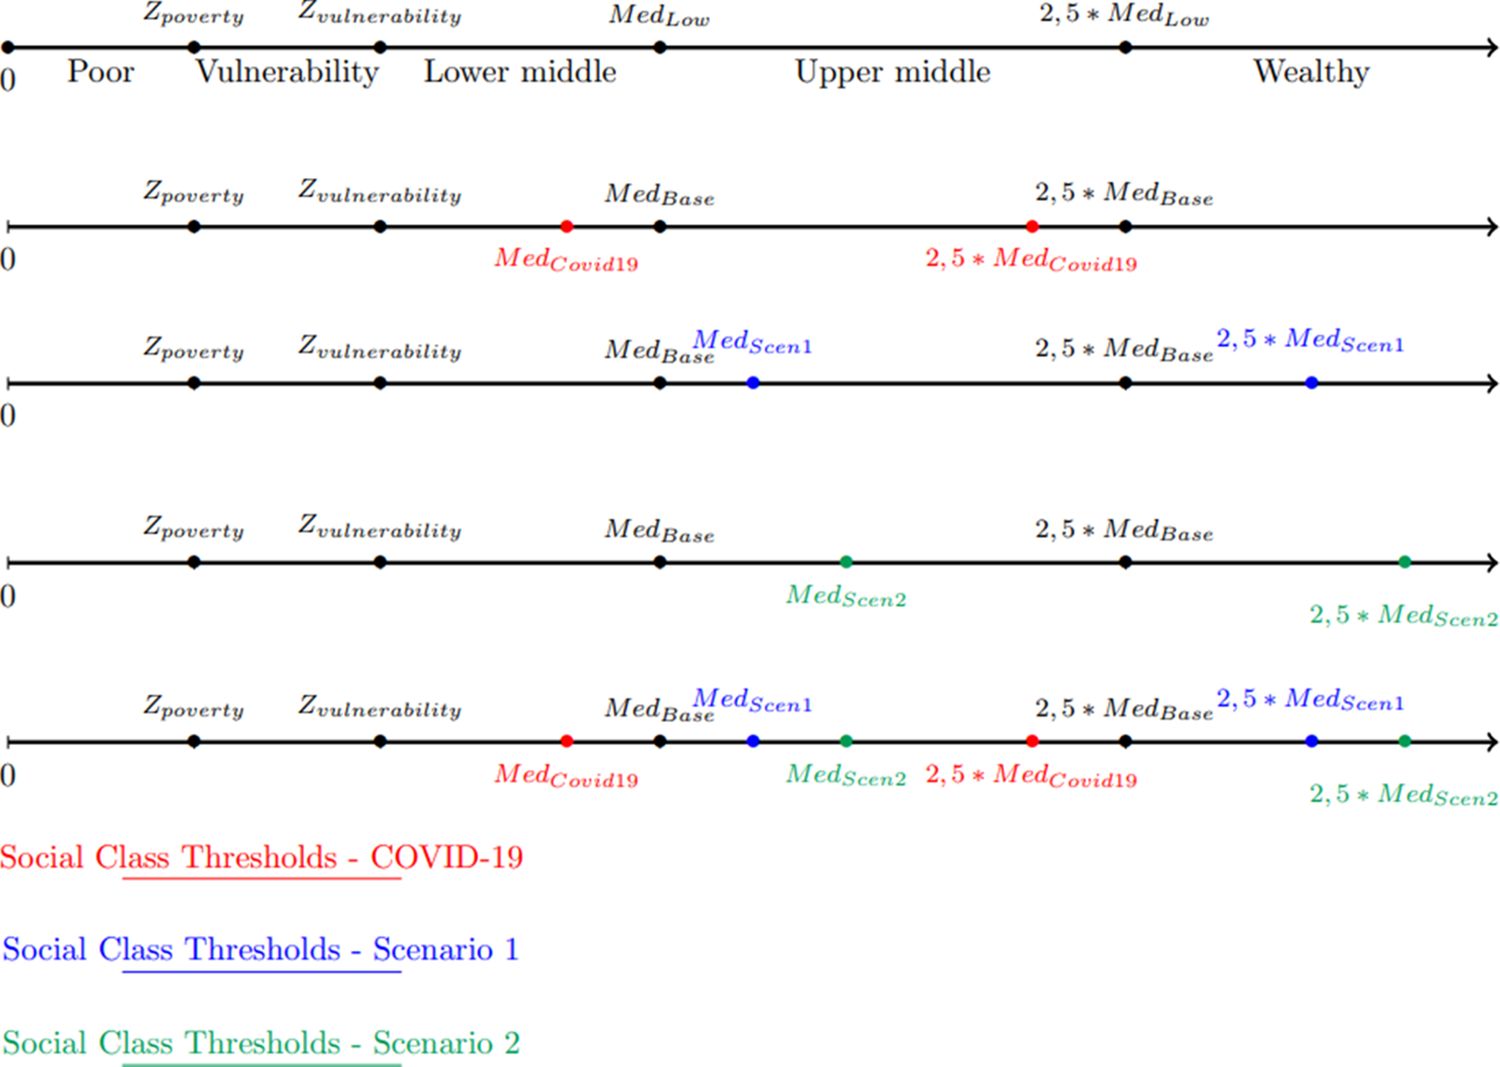
This implies that for each scenario, we have fixed thresholds (poverty and vulnerability) but variable ones when they are calculated from the median of distributions. See Figure A1 in the Appendix.
15.
These assumptions were postulated based on a combination of information coming from different sources namely Haut-Commissariat au Plan (2020a, CDG (2020) and Confédération générale des entreprises du Maroc-CGEM (2020). Information was not available directly but we used indirect information for these sources to construct these hypothesis.
16.
This concept implies that when prices faced by different households are the same, the original level of equivalent income would be equal to the level of original income and the post reform level of equivalent income would equal original income plus the equivalent gain (King, 1983).
17.
Cf. Information note from the Haut-Commissariat au Plan on the consumer price index (CPI) for March 2020.
18.
For validation purposes, we compared the price variations (our 39 prices) with the 12 prices published by the HCP to ensure that our variations were comparable to those of the HCP.
19.
Indeed, measures aimed at firms can only be properly captured using another modeling tool (a computable general equilibrium model (CGEM), for example) in order to trace the indirect effects of these measures on households.
20.
Tayssir is a cash transfer program implemented to fight against school dropout.
21.
All other density curves are available upon request.
22.
They were introduced by (Ravallion and Chen, 2003) to analyze the dynamics of poverty in relation to economic growth and changes in inequality.
23.
By definition of this decomposition, the sum of the components contributing to the variation of the indices considered is equal to 100. It can therefore be interpreted in relative terms.
Appendix
Social Class Thresholds - Baseline and Scenarios
References
- 1
- 2
-
3
COVID-19 Crisis Through a Migration LensCOVID-19 Crisis Through a Migration Lens, COVID-19 Crisis Through a Migration Lens, 10.1596/33634.
- 4
-
5
Development policy and planning: an introduction to models and techniquesPsychology Press.
- 6
-
7
Coronavirus nombre de cas au Maroc en Directhttps://www.coronavirus-statistiques.com/stats-pays/coronavirus-nombre-de-cas-maroc/, Accessed, 4 November 2022.
- 8
- 9
- 10
-
11
The Impact Of Covid-19 In Morocco: Macroeconomic, Sectoral And Regional Effects, Policy Center for the New SouthResearch Paper 20-17, Rabat.
- 12
- 13
-
14
Enquête Sur l’impact Du Coronavirus Sur La Situation Économique, Sociale et Psychologique Des MénagesNote de synthèse.
- 15
-
16
Impact Social & Économique de La Crise Du COVID-19 Au Maroc: Note Stratégique13, Impact Social & Économique de La Crise Du COVID-19 Au Maroc: Note Stratégique, Rabat, Morocco, p.
- 17
-
18
Regional Economic Outlook Update: Middle East and Central Asia Statistical AppendixRegional Economic Outlook Update: Middle East and Central Asia Statistical Appendix, FMI, https://www.imf.org/~/media/Files/Publications/REO/MCD-CCA/2020/April/English/reo-statistical-appendix.ashx.
- 19
-
20
Model-independent comparison of direct versus indirect detection of supersymmetric dark matterPhysical Review Letters 74:5174–5177.https://doi.org/10.1103/PhysRevLett.74.5174
-
21
Welfare analysis of tax reforms using household dataJournal of Public Economics 21:183–214.https://doi.org/10.1016/0047-2727(83)90049-X
-
22
Combining input-output analysis and micro-simulation to assess the effects of carbon taxation on Spanish householdsFiscal Studies 20:305–320.https://doi.org/10.1111/j.1475-5890.1999.tb00015.x
- 23
-
24
Poverty Vulnerability: The Role of Poverty Lines in the Post-Pandemic EraEconomics Bulletin 41:2690–2696.
-
25
Input-Output Analysis, Foundations, and ExtensionsCambridge university press.https://doi.org/10.1017/CBO9780511626982
-
26
Synthèse Du Rapport Economique et Financier Accompagnant Le Projet de Loi Des Finances (REF 2021)Rabat: MEF.
-
27
The COVID-19 Crisis in Morocco, in Tackling COVID-19: Contributing to the Global EffortParis: OECD.
- 28
- 29
-
30
Estimates of the impact of COVID-19 on global povertyWIDER Working Paper.
- 31
- 32
Article and author information
Author details
Touhami Abdelkhalek

Dorothée Boccanfuso
Funding
No specific funding for this article is reported.
Acknowledgements
The authors wish to thank ONDH for giving us early acces to survey data, John Cockburn and Luca Tiberti for proprosing this research topic to us and finally Medhi Halmi of l’UNICEF Rabat for valuable input on this paper.
This research work was carried out with financial support from the Partnership for Economic Policy (PEP) and the Oxford Policy Management (OPM) with funding from UNICEF MENA. We thank ONDH for giving us early access to the 2019 household panel survey, Mehdi Halmi, John Cockburn and Luca Tiberti for valuable comments to improve this paper. Regular caveats apply.
Publication history
- Version of Record published: December 31, 2022 (version 1)
Copyright
© 2022, Abdelkhalek et al.
This article is distributed under the terms of the Creative Commons Attribution License, which permits unrestricted use and redistribution provided that the original author and source are credited.