Modeling Work Incentives in Microsimulation Models
- Department of Economics, Sweden
Cite this article
as: A. Klevmarken; 2022; Modeling Work Incentives in Microsimulation Models; International Journal of Microsimulation; 15(1); 97-106.
doi: 10.34196/ijm.00253
Figures
Figure 1

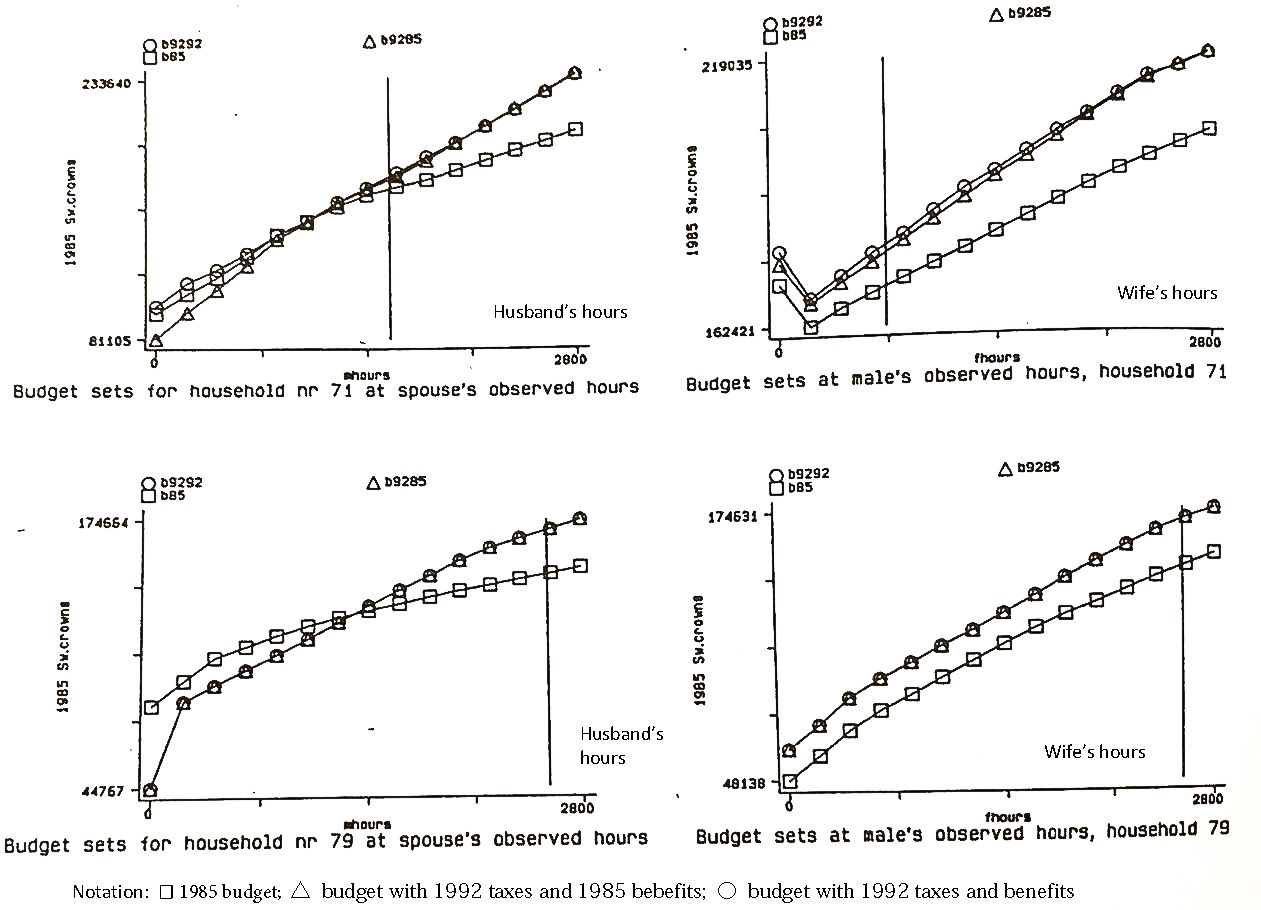
Budget sets for two households by husband’s and wife’s workhours. Source: Klevmarken et al. (1995) Figure 2.7.
Figure 2

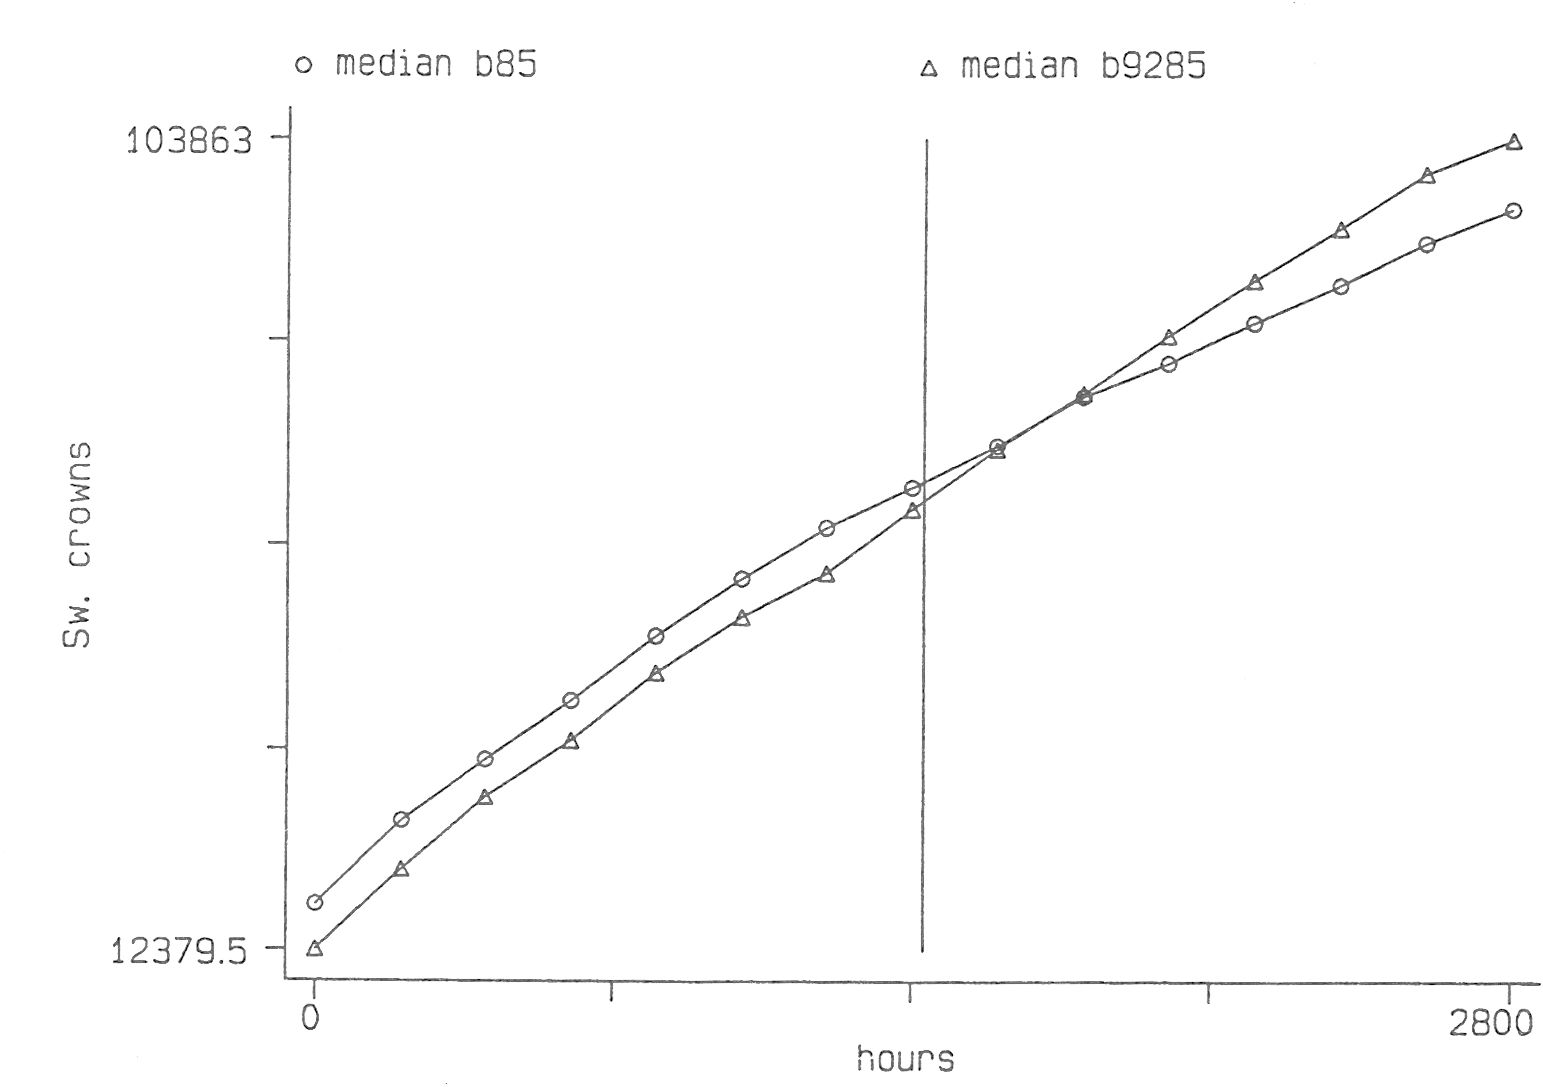
Median Budget sets for single women 1985 with 1985 taxes and benefits and with 1992 taxes and 1985 benifits respectively. Source: Klevmarken et al. (1995) Figure 2.8.
Figure 3

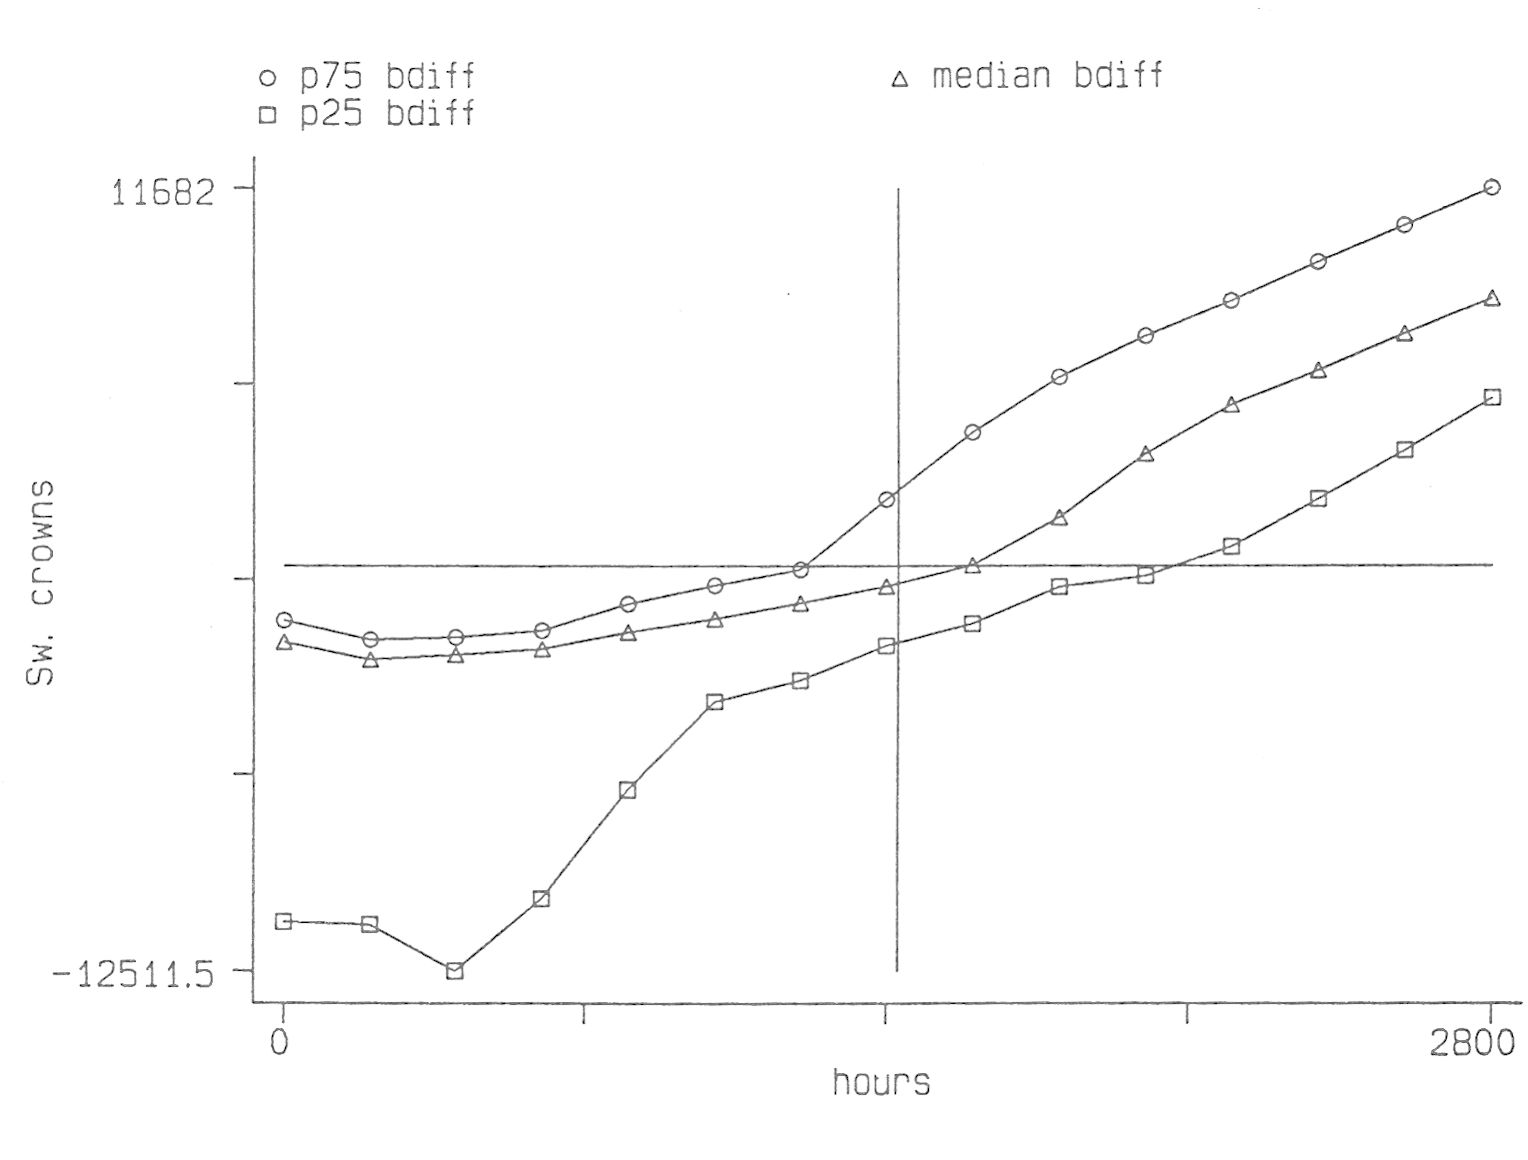
Quartile changes in disposable income by workhours for single women caused by the taxchanges 1985-92. Source: Klevmarken et al. (1995) Figure 2.11.
Figure 4

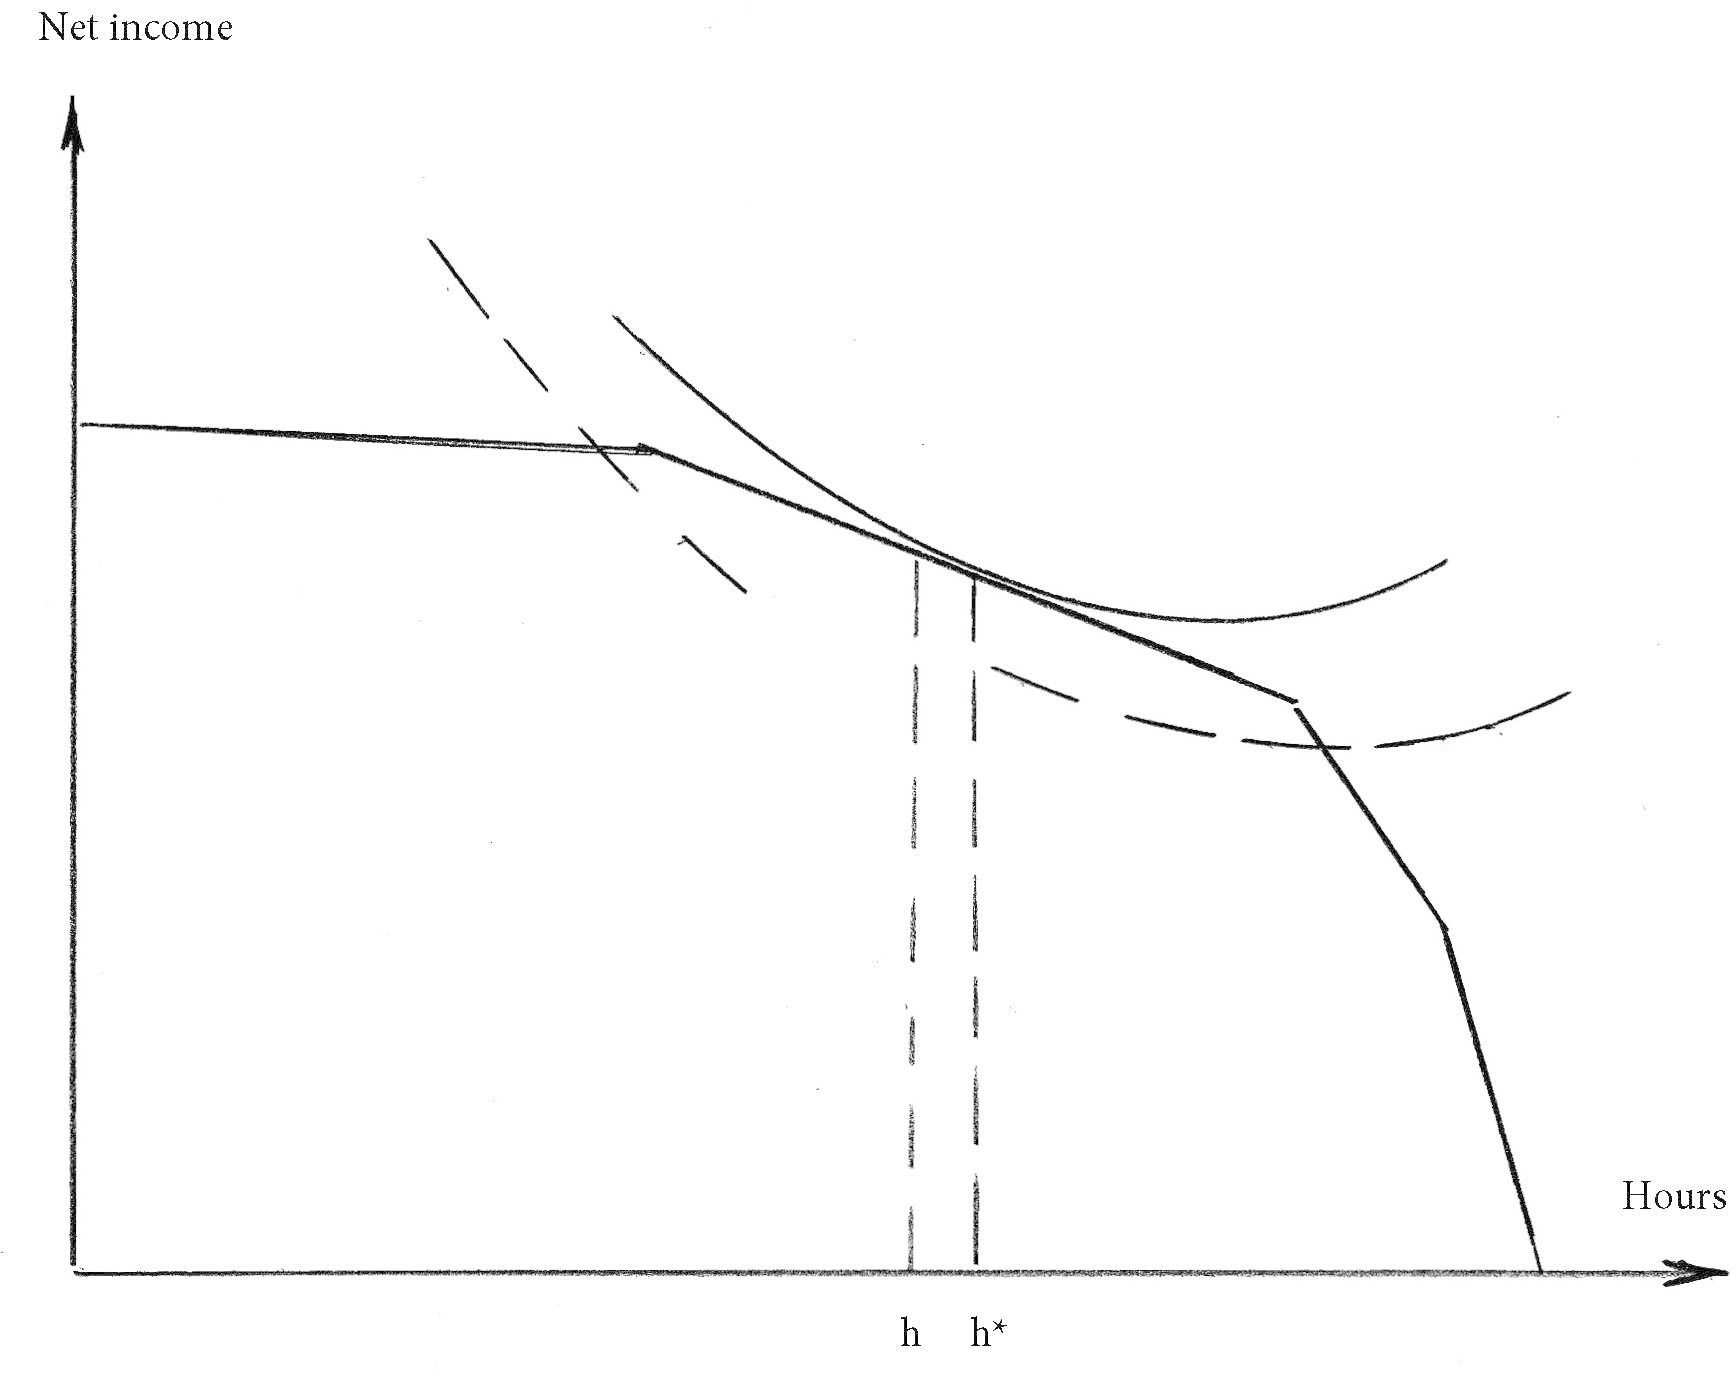
Budget set and indifference curves.
Figure 5
Distribution of working hours, males. Simulated values from a Hausman model. Source: van Soest et al. (1990).
Figure 6

Distribution of working hours per week, females. Simulated vales from a Hausman model. Source: van Soest et al. (1990).
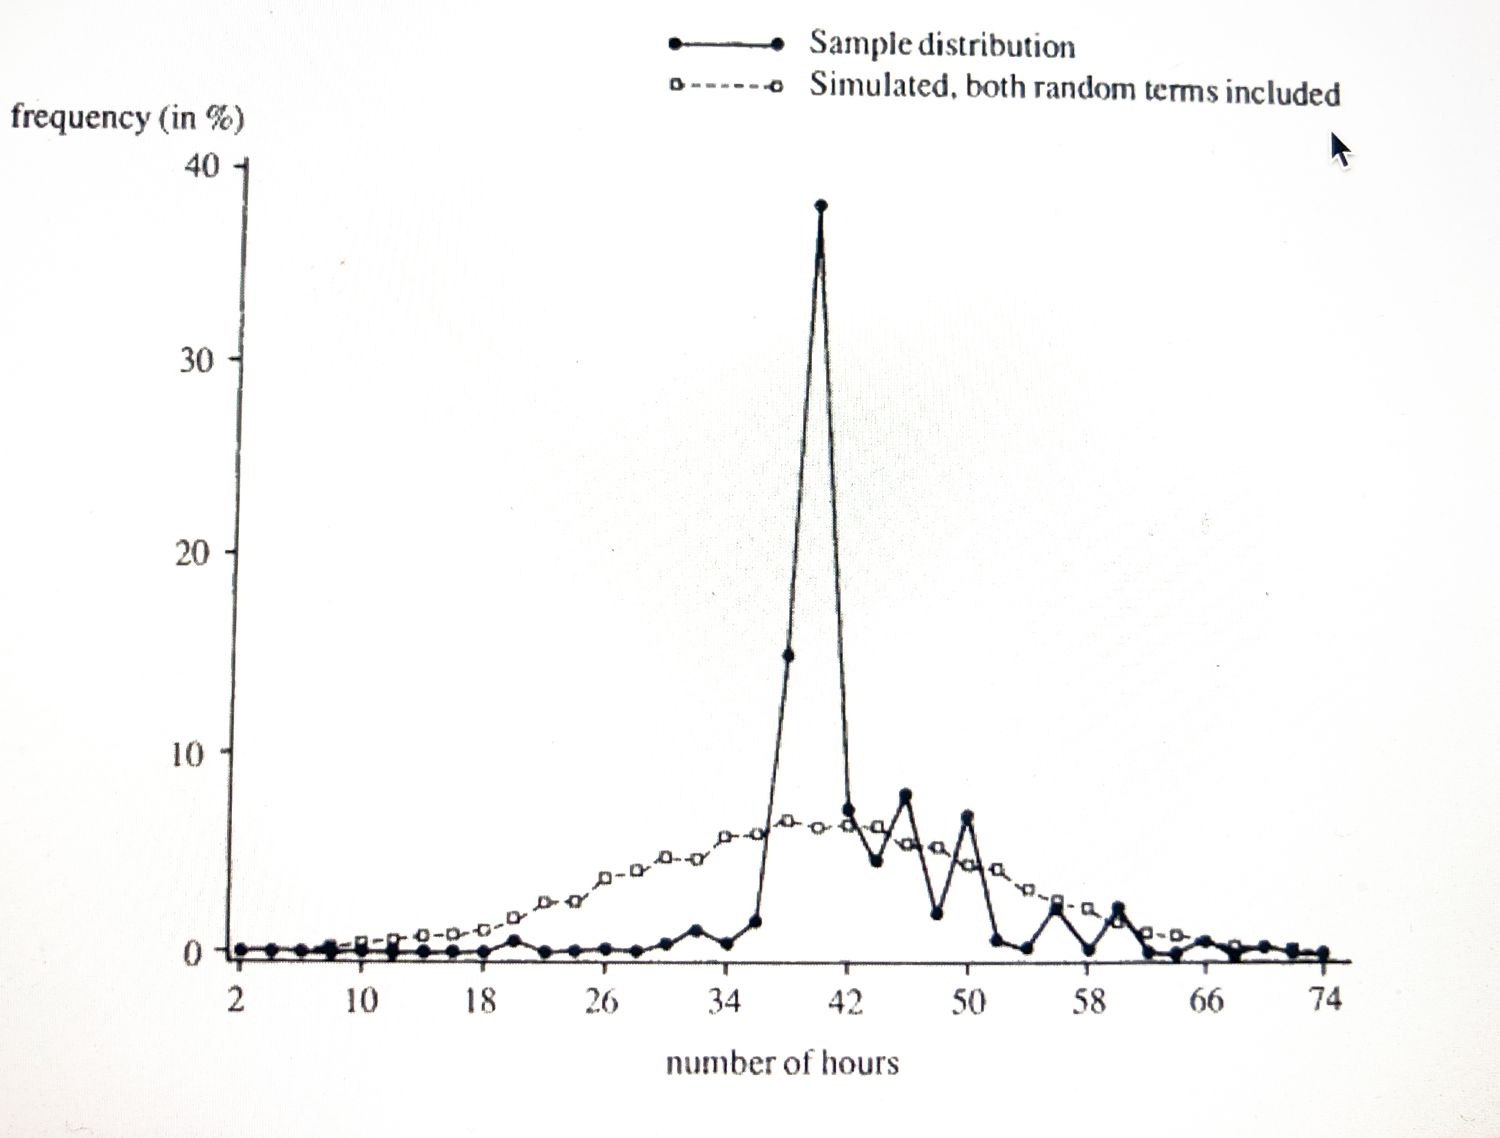
Figure 7

Distribution of working hours per week, males. Simulated hours from a model including offered hours. Source: van Soest et al. (1990), Figure 2.
Figure 8
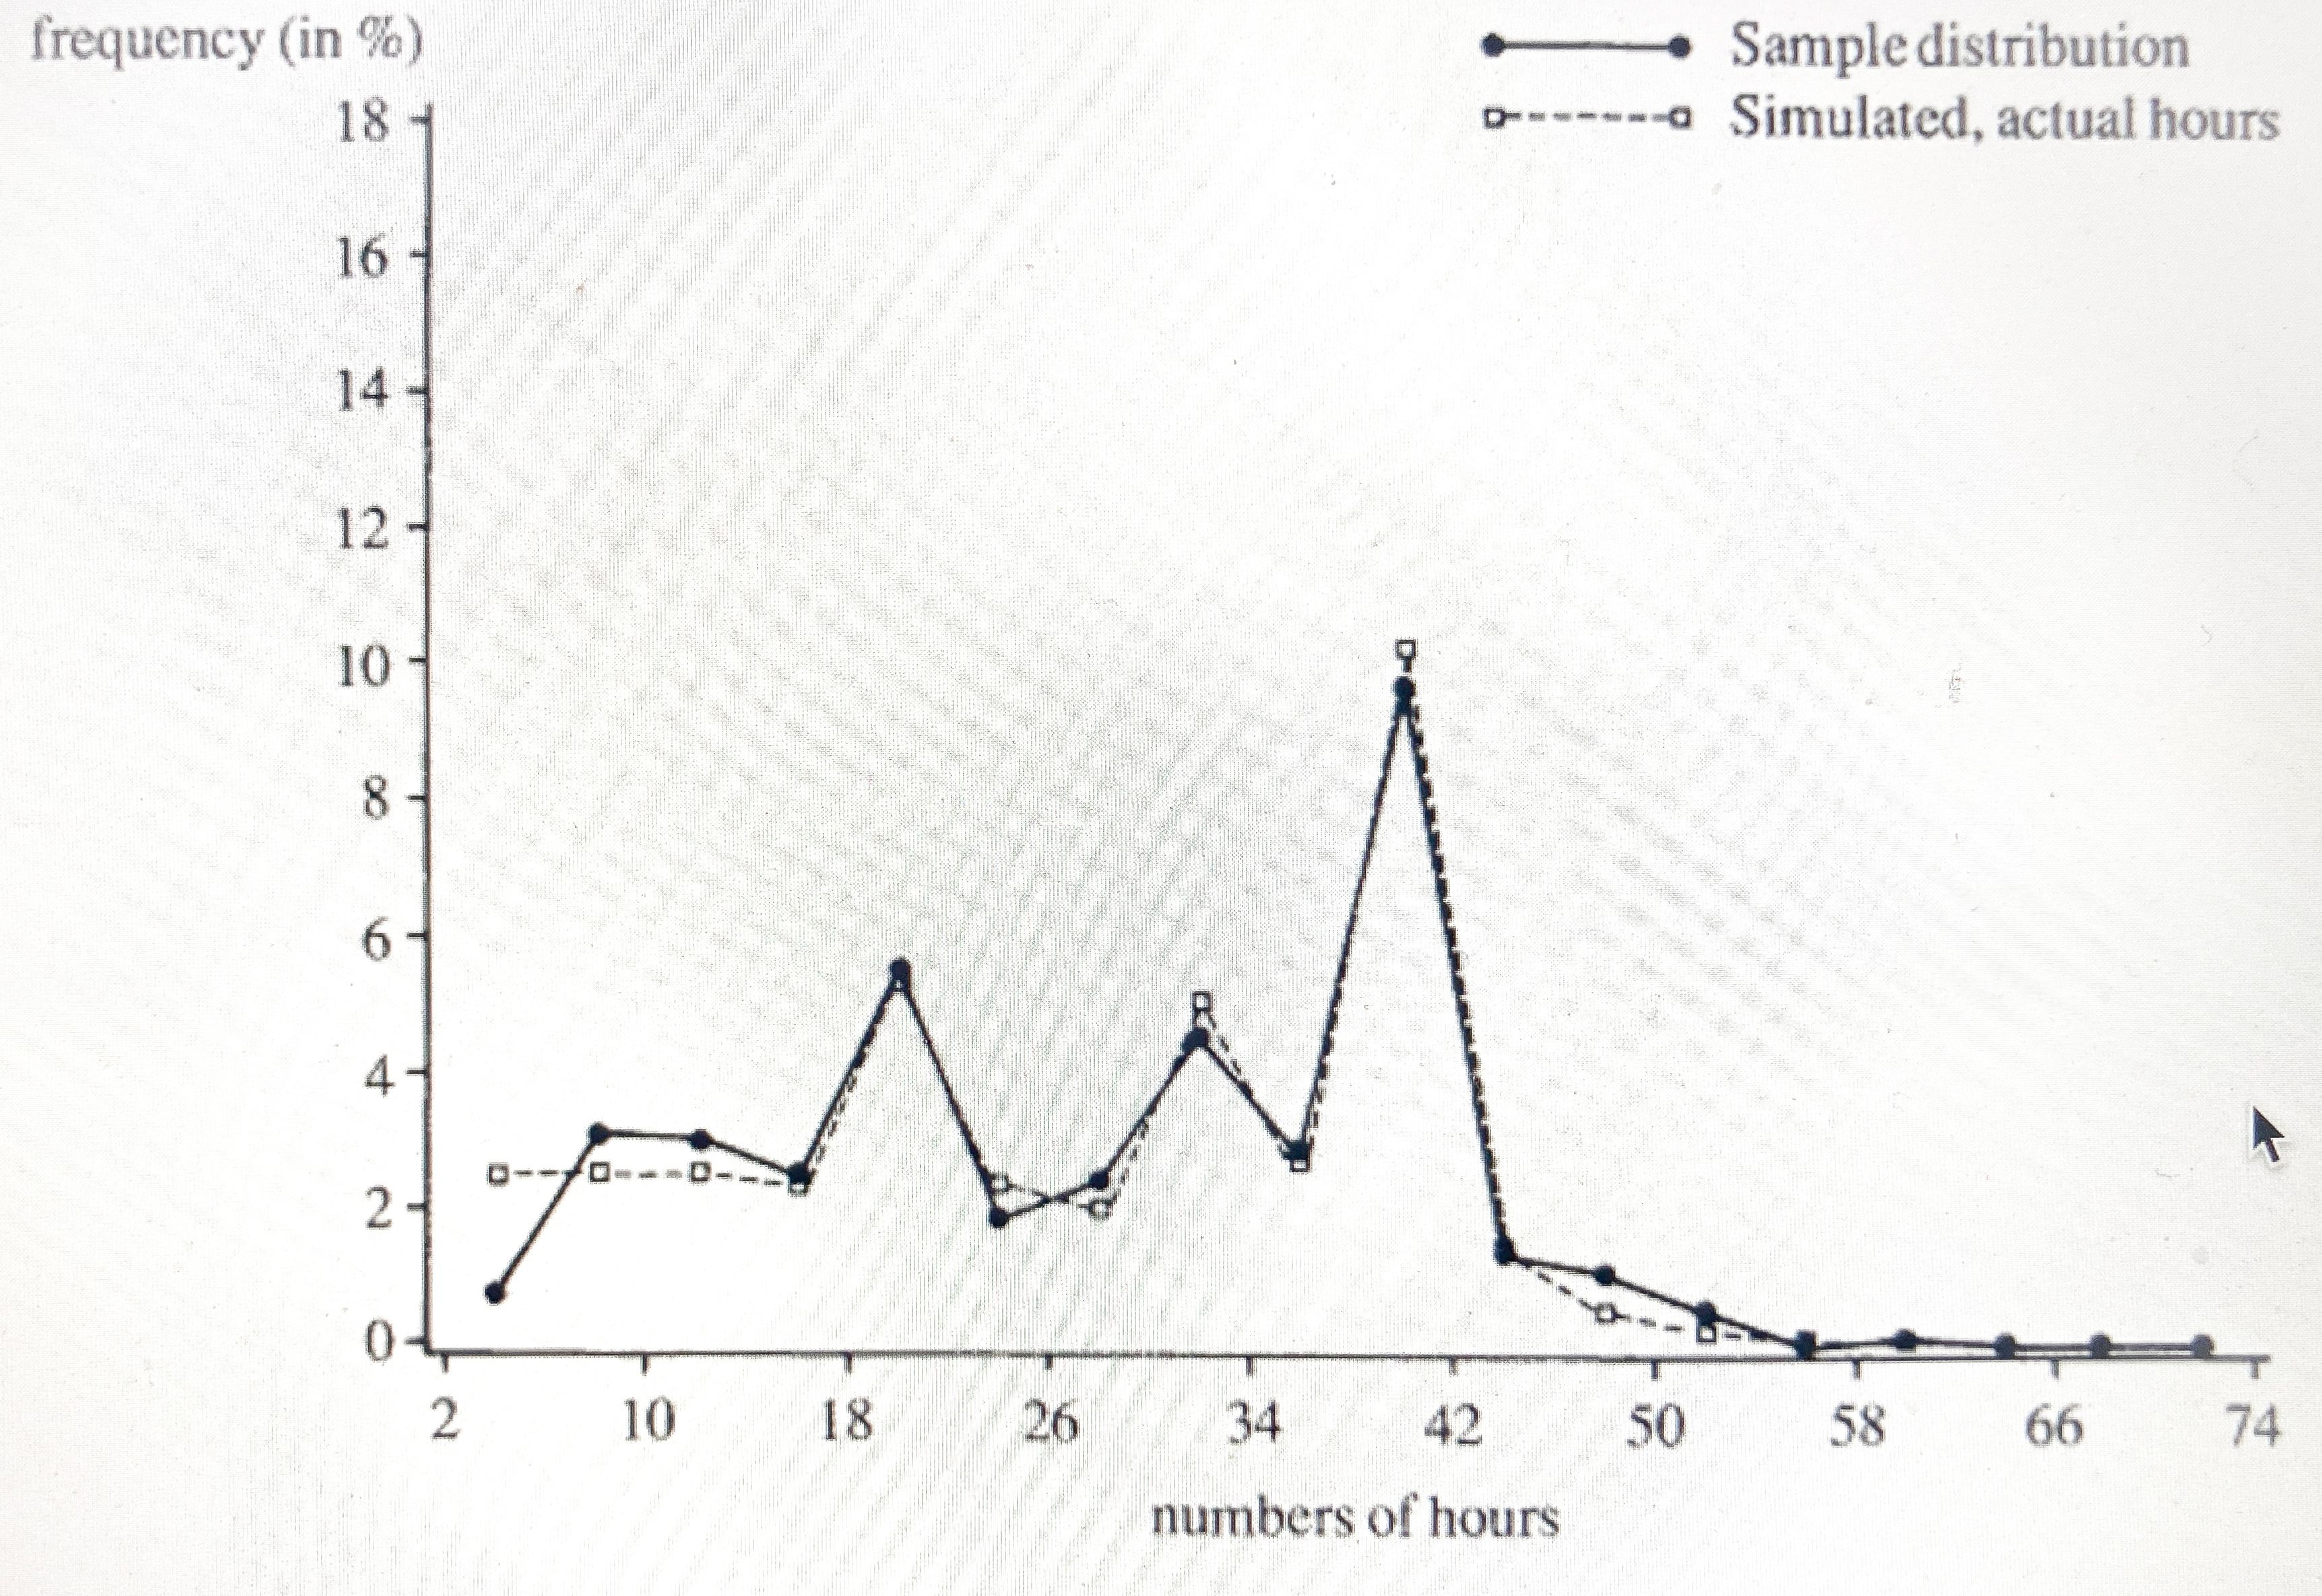

Distribution of working hours per week, females. Simulated values from a model including offered hours. Source: van Soest et al. (1990).
Tables
Table 1
Estimated wage rate and income elasticities from a Hausman model in MICROHUS.
| Elasticities* | Singles | Males | Females |
|---|---|---|---|
| Wage rate | 0.1433 | -0.0132 | -0.0057 |
| Income | -0.5813 | -0.1813 | -0.1493 |
| Compensated | 0.6011 | 0.1296 | 0.1119 |
-
*
Note: The last two columns include estimates for married and cohabiting couples.
Data and code availability
Please contact the authors for information on data and code availability.
Download links
A two-part list of links to download the article, or parts of the article, in various formats.