Collecting Data for Micro Analysis: Experiences from the Hus-pilot Study
- Department of Economics, Sweden
Cite this article
as: A. Klevmarken; 2022; Collecting Data for Micro Analysis: Experiences from the Hus-pilot Study; International Journal of Microsimulation; 15(1); 15-30.
doi: 10.34196/ijm.00247
Figures
Figure 1
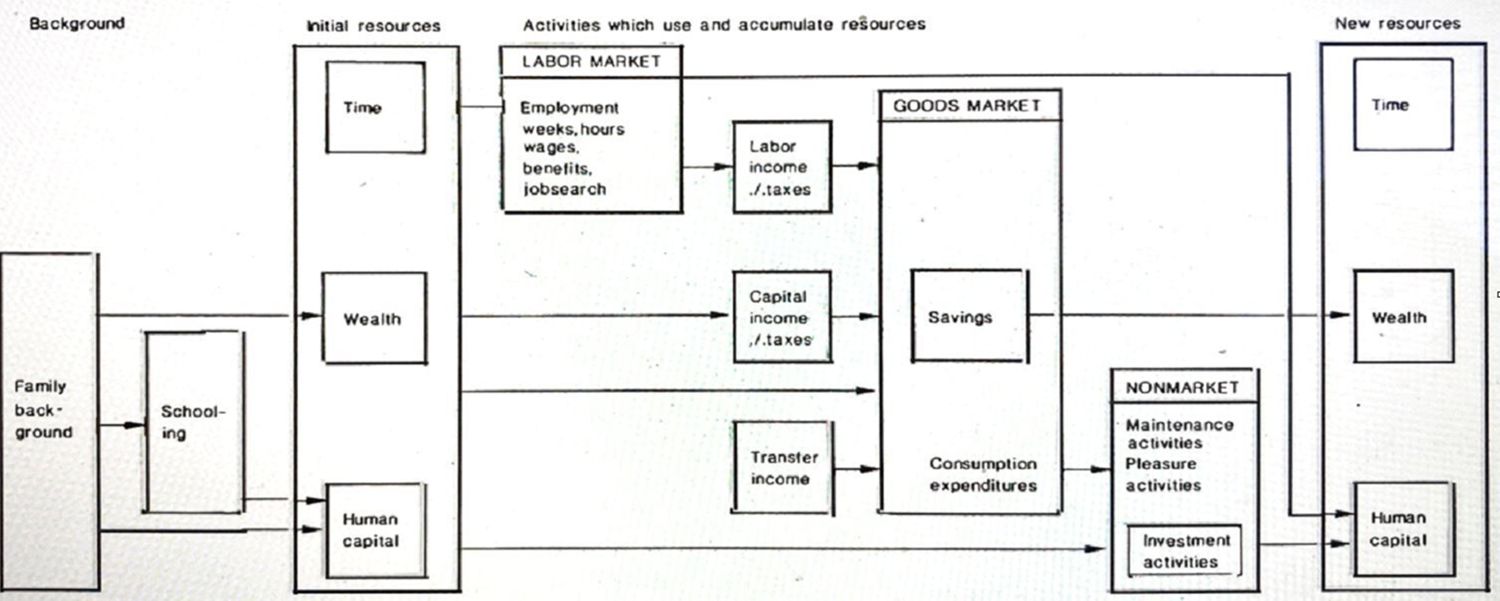
Use and accumulation of household resources in market and nonmarket activities.
Tables
Table 1
Response by Type of Contact
| Type of contact | ||||
|---|---|---|---|---|
| Contact interview | Leave behind diaries | Interview 1 inc. yesterday quest | Interview 2 | |
| Sample size, households | 315 | |||
| Household members in household with contact interview | 403 | 403 | 403 | 403 |
| Respondents, households | 224 | |||
| Respondents, individuals | 305 | 317* | 316 | |
| Response rate (%) | 72.3 | 75.7 | 78.7* | 78.4 |
| Nonresponse by reason (%) | ||||
| not found | 2.4 | 0.5 | 4.0 | 2.0 |
| refusal | 24.4 | 21.3 | 17.1 | 18.6 |
| other | 0.9 | 2.5 | 0.2 | 1.0 |
| total non-response | 27.7 | 24.3 | 21.3 | 21.6 |
| Cumulative response | 403 | 305 | 280 | 268 |
| Cumulative response rate (%) | 100.0 | 75.7 | 69.5 | 66.5 |
-
*
7 individuals (1.7 %) did not respond to the yesterday questions.
Table 2
Comparison between the 7 Days Expenditure Diary and Yesterday Questions.
| Commodity | Average expenditure difference per head | Standard error |
|---|---|---|
| 1. Meals outside home | 27.73 | 8.92 |
| 2. Everyday commodities | 161.34 | 68.06 |
| 3. Clothing, shoes, etc | 16.23 | 65.34 |
| 4. Personal care services | 12.33 | 14.53 |
| 5. Medicine, etc. | 24.35 | 7.08 |
| 6. Medical services | 6.15 | 7.35 |
| 7. Childcare | 24.58 | 7.96 |
| 8. Housing | 212.40 | 288.65 |
| 9. Durables | 147.05 | 48.78 |
| 10. Transport and communication | 171.44 | 121.40 |
| 11. Pleasure, hobby and recreation | 3.86 | 46.01 |
| 12. Use and maintenance of vacation house and boat | -3.07 | 13.95 |
| 14. Mortgage payments etc | -9.12 | 30.25 |
| 15. Other commodities | -0.23 | 0.23 |
-
Note: Sample size is 147 households. No expenditures were recorded for Commodity, 13, Courses and education, or for 16, Other services.
Table 3
Comparison of Estimates from Personal Visits and Telephone Interviews. (Expenditures per head are given in Swedish kronor and time-use per head in minutes).
| Commodity or activity | Average difference | Standard deviation |
|---|---|---|
| Meals during work outside home | 1.70 | 1.25 |
| Everyday commodities | -18.71 | 14.74 |
| Clothing, shoes, etc | 1.32 | 18.87 |
| Durables | 9.77 | 5.70 |
| Transport and communication | 11.71 | 20.86 |
| Pleasure, hobbies and recreation | -1.31 | 11.31 |
| Work for pay, etc | -4.63 | 63.73 |
| Household work | -4.69 | 32.99 |
| Care activities excl. sleep and rest | -28.21 | 29.92 |
| Sleep and rest | -17.19 | 44.74 |
| Shopping | -2.13 | 18.44 |
| Maintenance and repairs | 33.74 | 17.37 |
| Education and courses | -6.29 | 26.38 |
| Pleasure and recreation | -28.91 | 68.17 |
| Travel | 57.36 | 23.00 |
| Other communication | -7.83 | 9.22 |
| Don’t remember, refusal, gap | 8.78 | 8.13 |
Table 4
Time-Use Estimates from Yesterday Questions Compared to Retrospective Questions for 14 Days.
| f | y | n | f | y | n | Δf | Δy | |
|---|---|---|---|---|---|---|---|---|
| Maintenance and repairs | 0.459 | 136 | 48 | 0.425 | 51 | 29 | 0.034 | 85* |
| (0.095) | (23) | (0.102) | (11) | (0.140) | (25) | |||
| Sport activities, walks etc | 0.419 | 88 | 43 | 0.148 | 23 | 12 | 0.271 | 65* |
| (0.104) | (13) | (0.087) | (6) | (0.136) | (14) | |||
| Spectator activities | 0.186 | 137 | 20 | 0.213 | 15 | 13 | -0.027 | 122* |
| (0.081) | (14) | (0.093) | (5) | (0.123) | (15) | |||
| Guests at home | 0.192 | 77 | 20 | 0.489 | 34 | 26 | -0.297* | 43* |
| (0.079) | (12) | (0.103) | (7) | (0.130) | (14) | |||
| Guest with someone else | 0.491 | 180 | 56 | 0.470 | 74 | 26 | 0.021 | 106* |
| (0.103) | (20) | (0.099) | (20) | (0.143) | (29) | |||
| Sample size (after non·response) | 206 | 57 |
-
*
Significant at the 5 % level with a one-sided t-test. Standard error in parenthesis.
Table 5
Time off Work at Work Estimated from Yesterday Time-Use Diaries and Retrospective Questions. (Number of respondents by time-use in minutes.)
| Time-use diaries | Retrospective questions SY34-SY36 | |||||
|---|---|---|---|---|---|---|
| 1-15 | 16-30 | 31-45 | 46-60 | 61- | Total | |
| 0 | 3 | 3 | 2 | 1 | 6 | 15 |
| 1-15 | 0 | 0 | 0 | 0 | l | |
| 16-30 | 0 | 0 | 3 | 2 | 7 | 12 |
| 31-45 | l | l | 2 | 2 | 9 | 15 |
| 46-60 | 0 | 1 | 0 | 5 | 8 | 14 |
| 61- | 2 | 0 | 2 | 3 | 14 | 21 |
| Total | 6 | 5 | 9 | 14 | 44 | 78 |
Data and code availability
Please contact the authors for information on data and code availability.
Download links
A two-part list of links to download the article, or parts of the article, in various formats.