Using sequence analysis to visualize and validate model transitions
- Finnish Centre for Pensions, Finland
- University of Helsinki, Finland
- Tampere University, Finland
Cite this article
as: J. Salonen, J. Möttönen, H. Tikanmäki, T. Nummi; 2020; Using sequence analysis to visualize and validate model transitions; International Journal of Microsimulation; 13(2); 61-78.
doi: 10.34196/ijm.00218
Figures
Figure 1
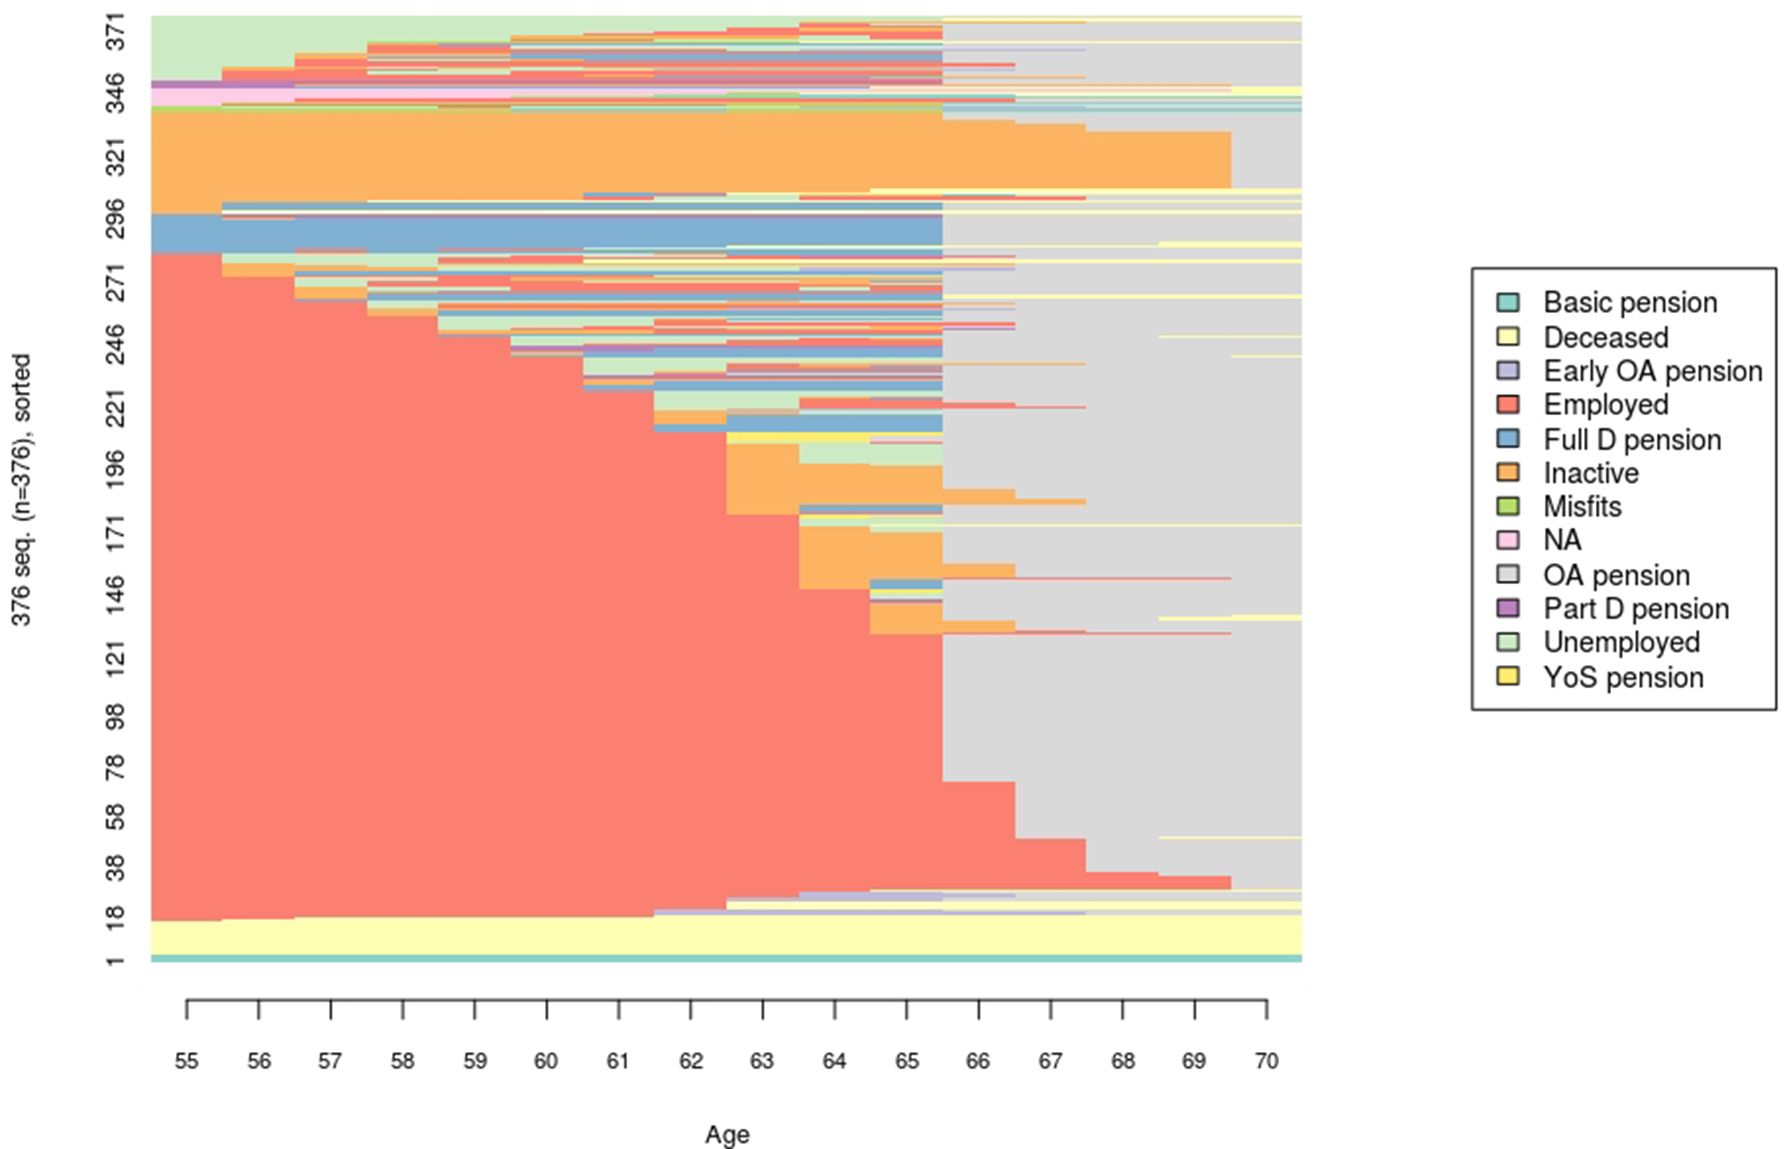

Sequence index plot of cohort born in 1970, individuals.
Figure 2
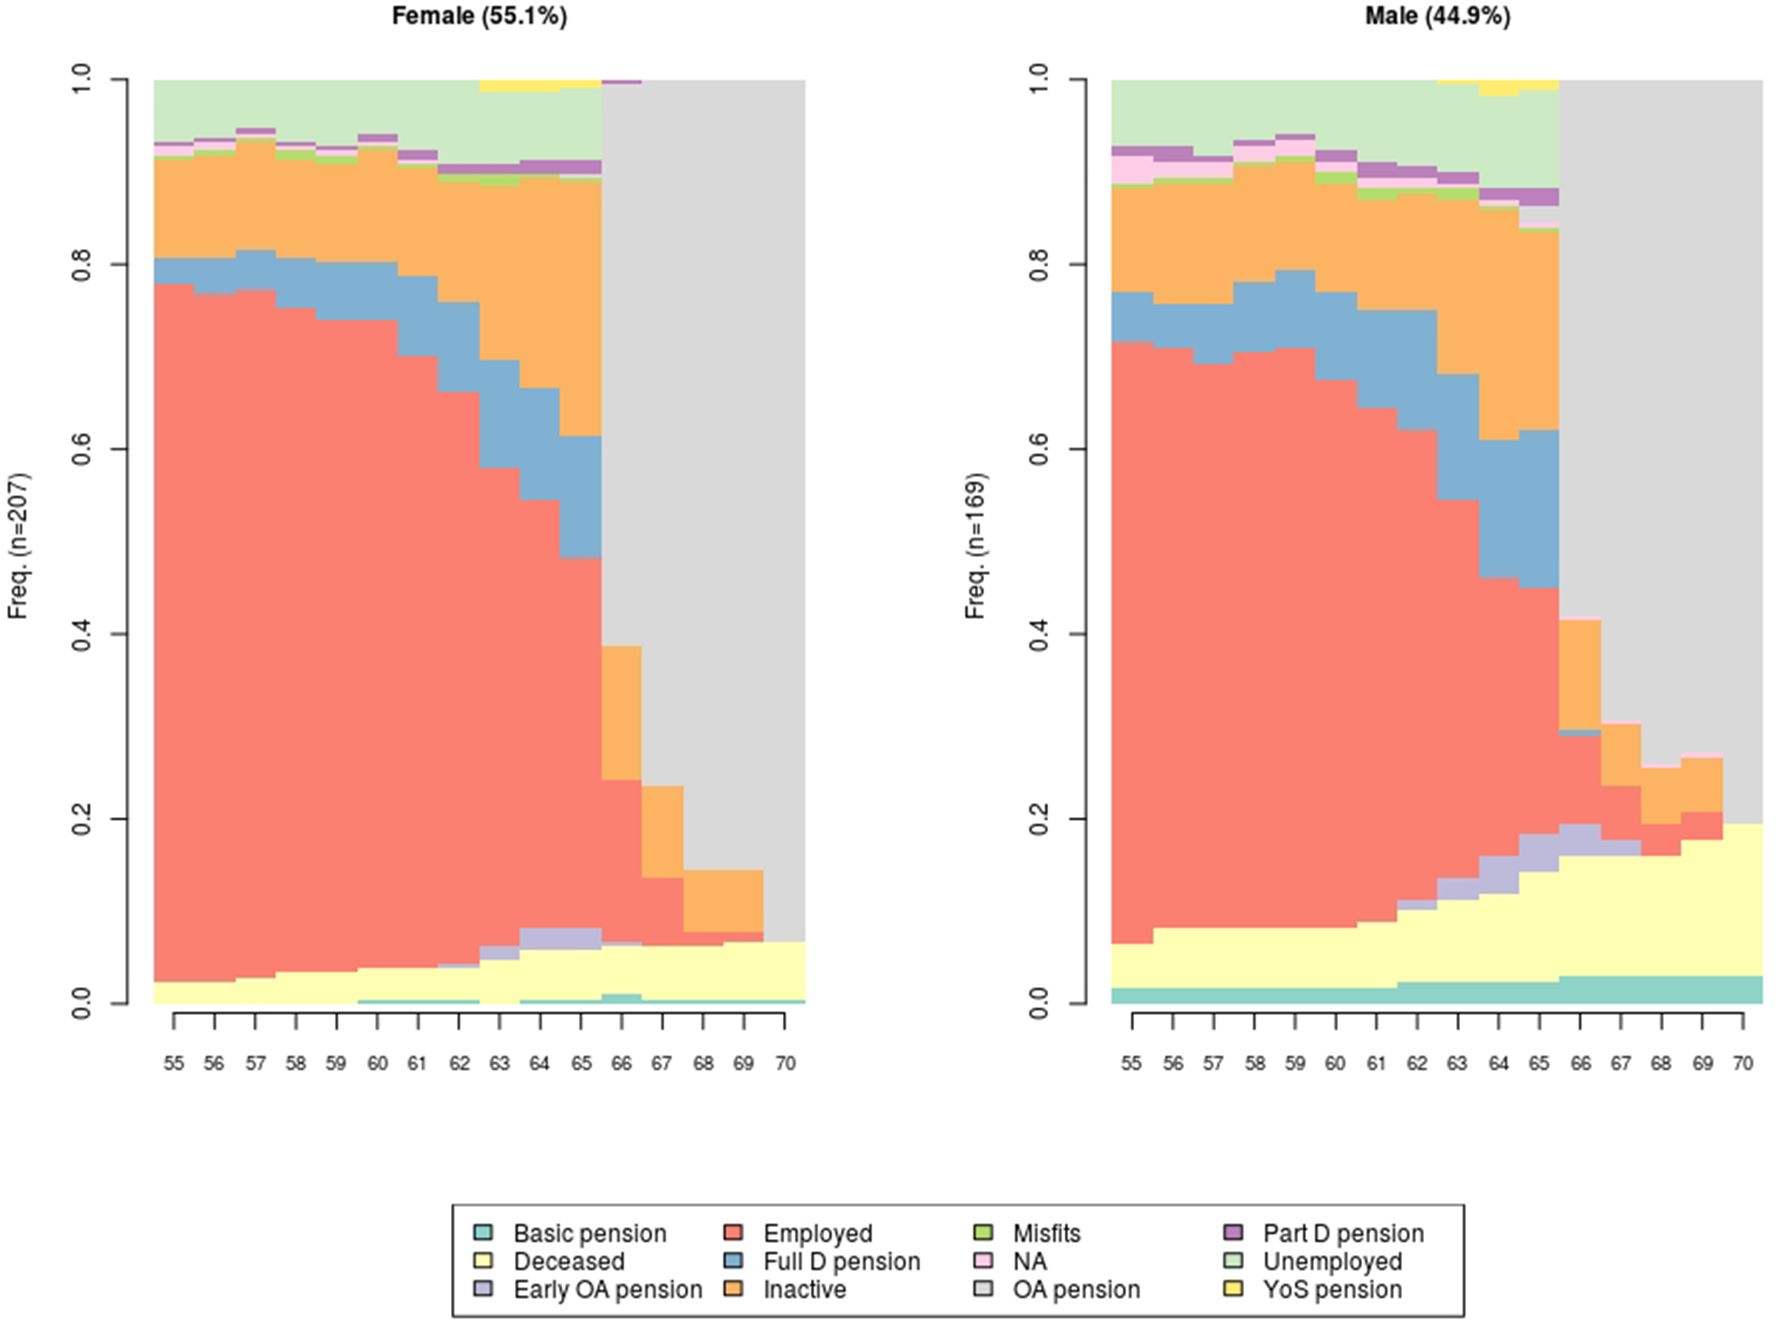

State distribution plot for the 1970 cohort by gender, per cent.
Figure 3

Mean time in state for 1970 cohort by education, years.
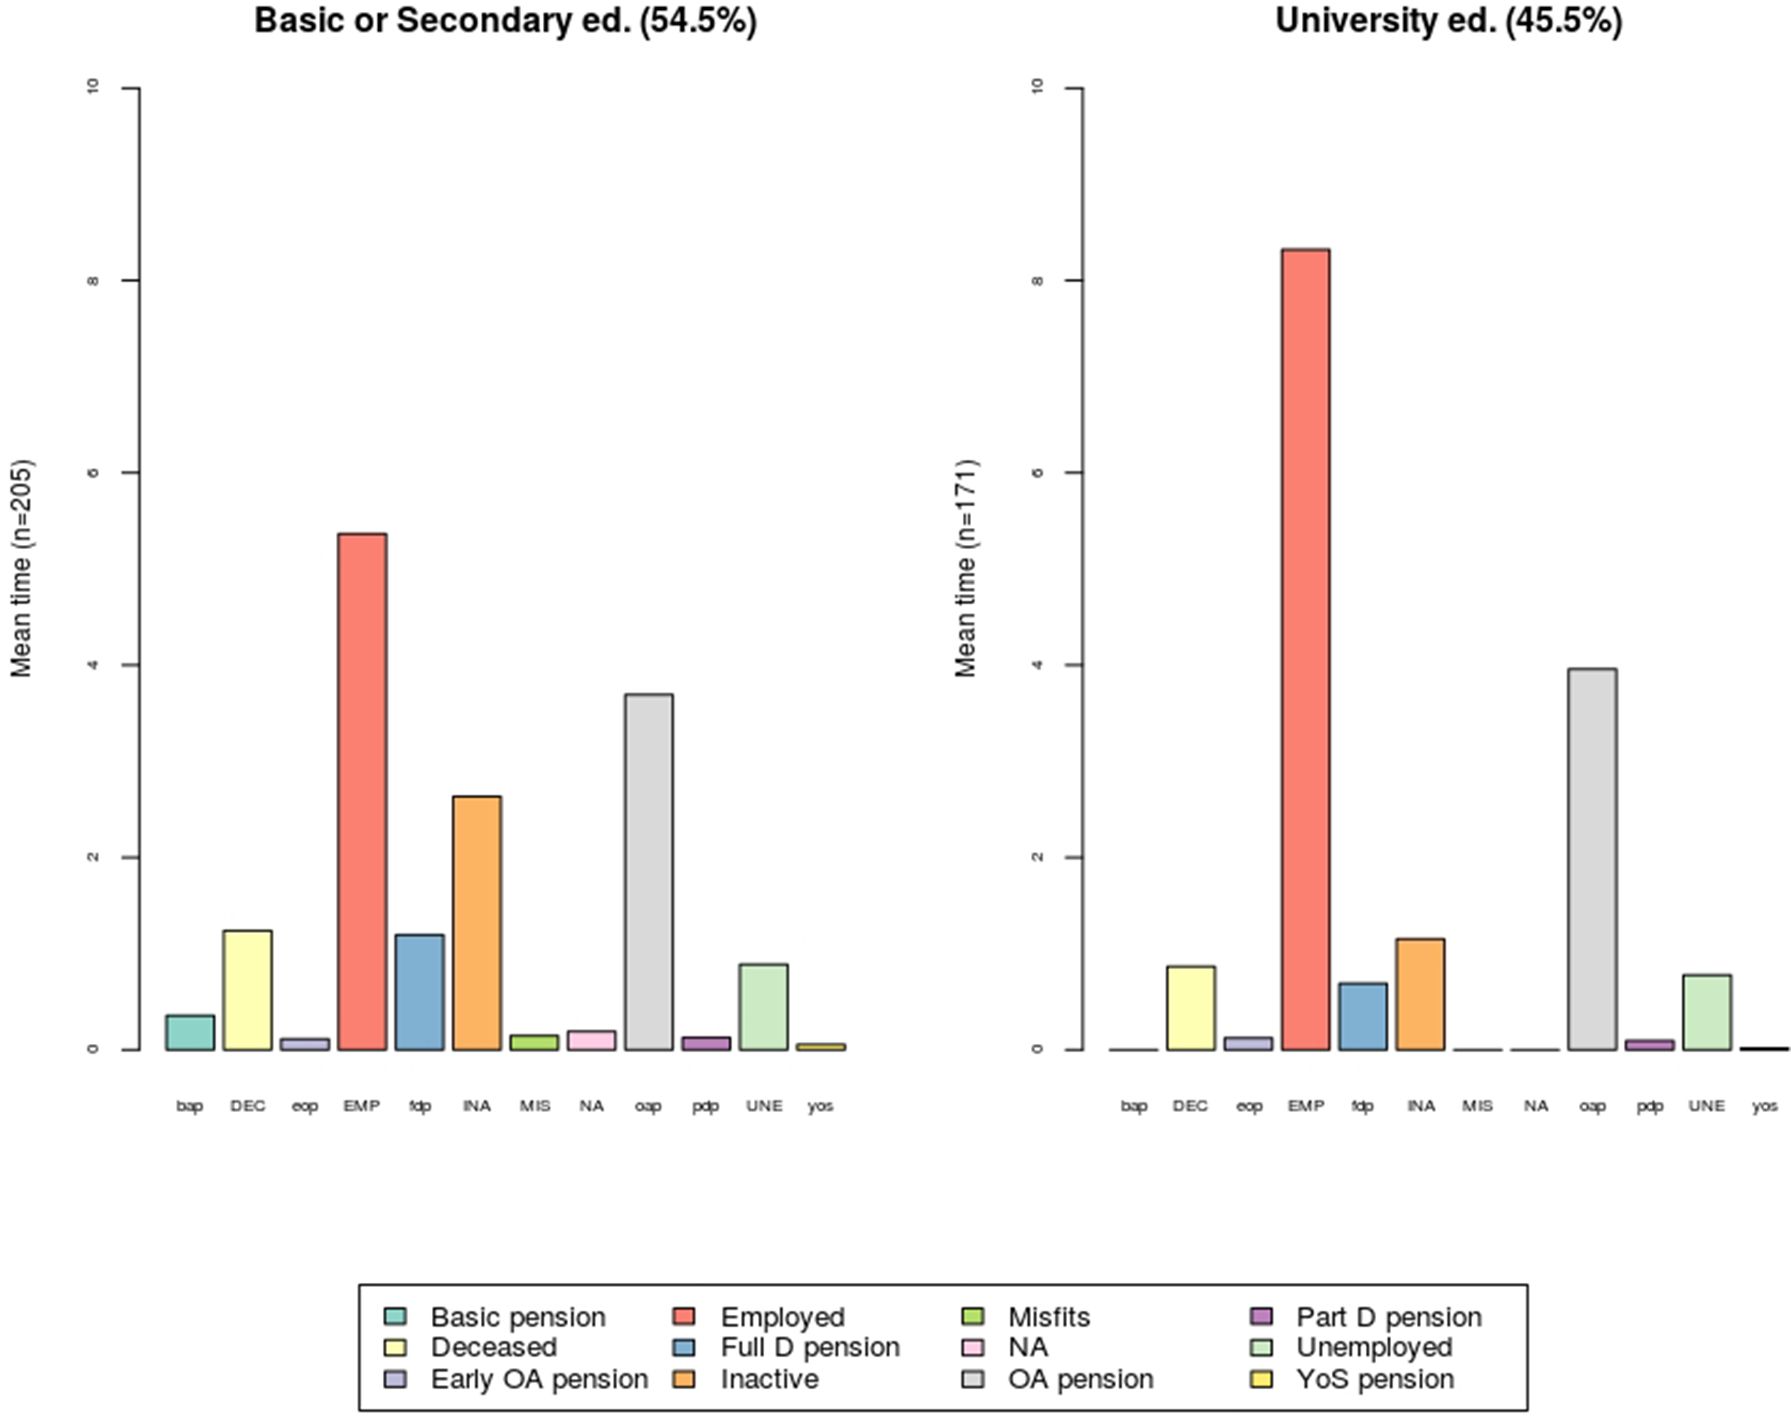
Figure 4

Clustering transition sequences of cohort born 1970.
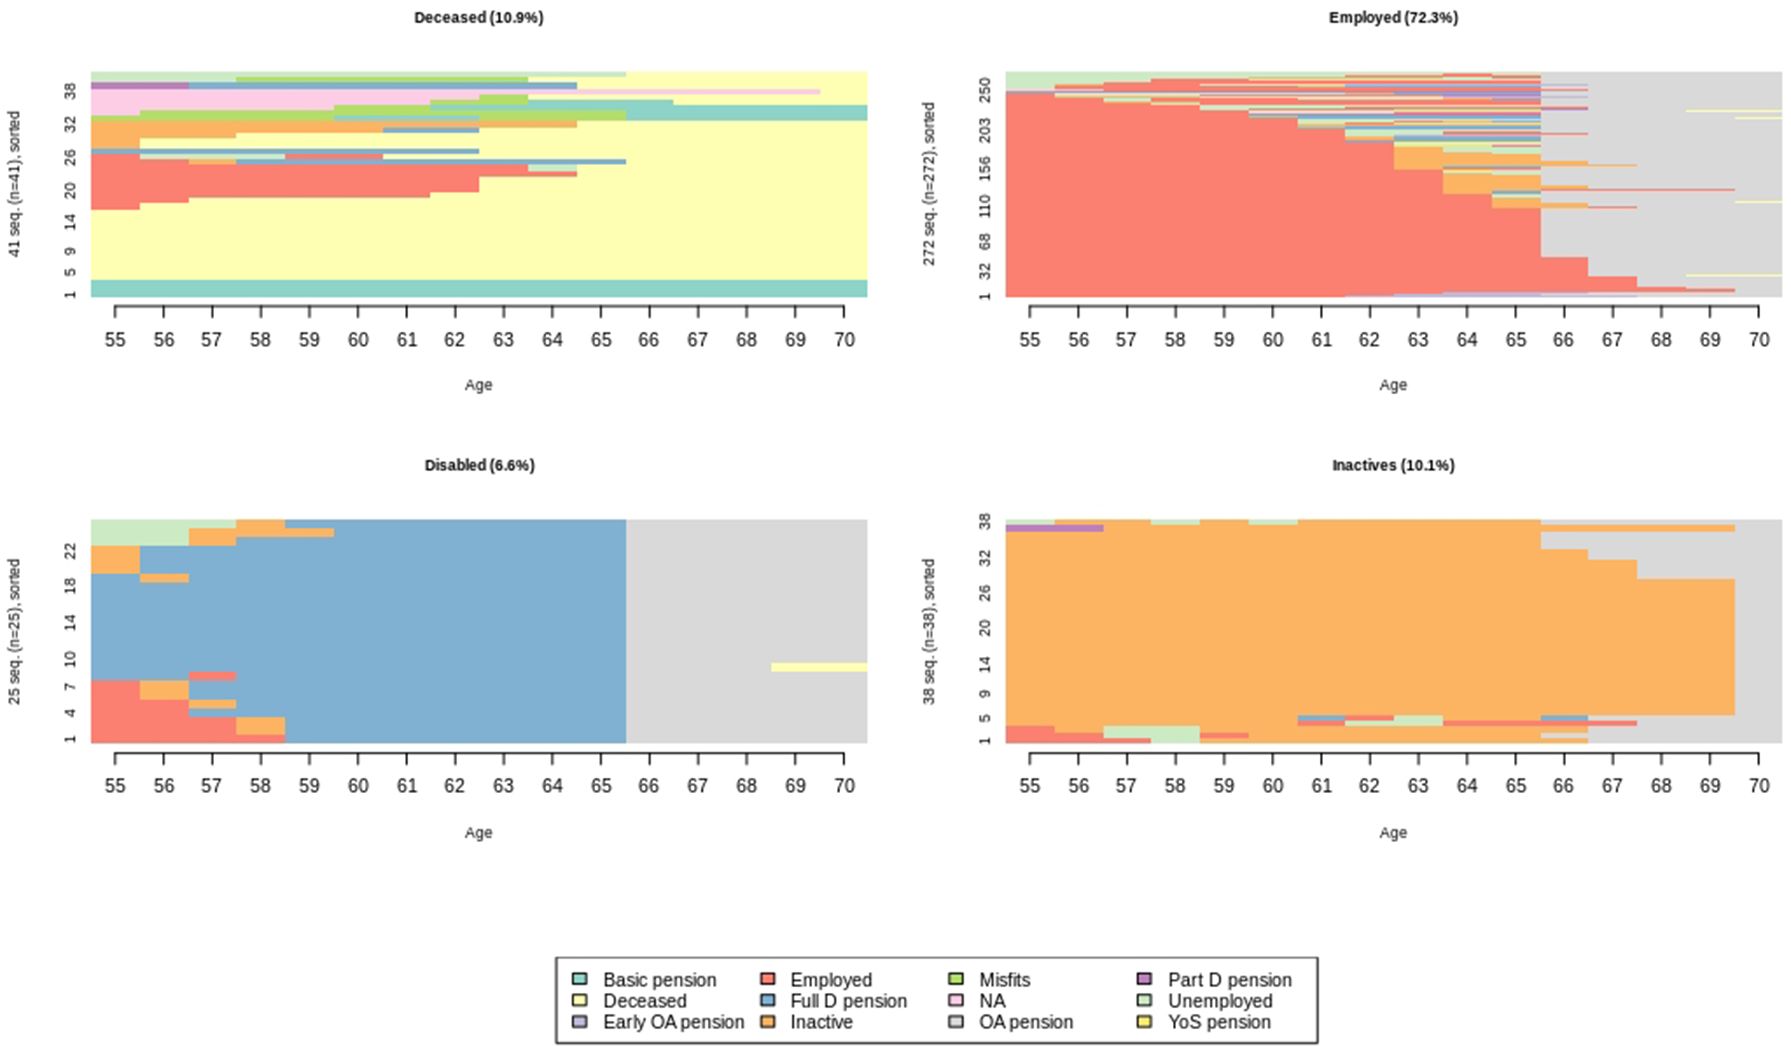
Figure 5
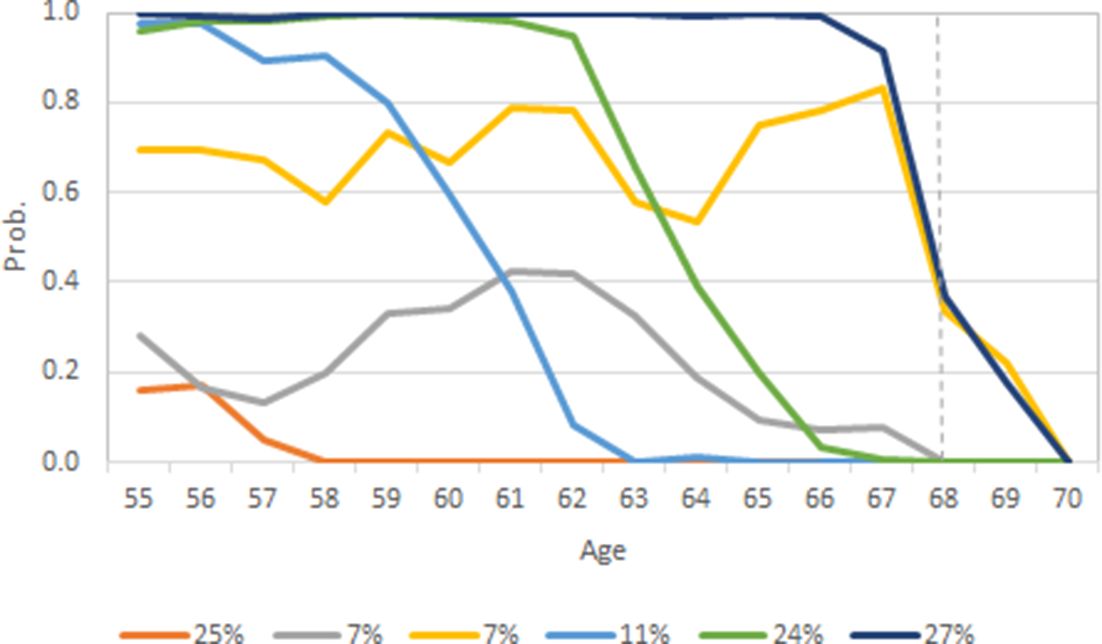
Employment trajectories of cohort born in 2000 (k=6). Dotted line indicates old-age retirement age.
Tables
Table 1
Labor market states and corresponding color codes in figures.
| Labor market state | ELSI state(s) | Abb. | Substantial contents |
|---|---|---|---|
| Basic pension | 21,22 | bap | National pension only |
| Deceased | 12 | DEC | Deceased people remain in the model population until the end of the simulation period |
| Early OA Pension | 7 | eop | Early old-age pension, retirement age adjusted for life-expectancy |
| Employed | 1,10,11,15,16 | EMP | Full or part time employed |
| Full D Pension | 9,5,17 | fdp | Full disability pension, leading to old-age pension |
| Inactive | 4,13,19 | INA | Outside the labor force |
| Misfits | 20 | MIS | Permanently outside the labor force |
| NA | ‘’ | NA | Technical state for sequence analysis, not a labor market state in ELSI |
| OA Pension | 8 | oap | Old-age pension, retirement age adjusted for life-expectancy |
| Part D Pension | 18 | pdp | Partial disability pension |
| Unemployed | 2,3 | UNE | Unemployed |
| YoS Pension | 6 | yos | Years-of-service pension. Available for individuals aged 63 who have had a long and strenuous working life. No subjective choice. |
-
Notes. The Non-aggregated model states are given in the Appendix A.2.
Table 2
Five most common transition sequences of cohorts born in 1970, 1980, 1990 and 2000, individuals and shares.
| Transition sequence | Count | % |
|---|---|---|
| 1970 | ||
| EMP/11 - oap/5 | 58 | 15.4 |
| INA/15 - oap/1 | 23 | 6.1 |
| EMP/12 - oap/4 | 22 | 5.9 |
| DEC/16 | 13 | 3.5 |
| EMP/13 - oap/3 | 13 | 3.5 |
| 1980 | ||
| EMP/12 - oap/4 | 57 | 15.4 |
| INA/15 - oap/1 | 25 | 6.8 |
| DEC/16 | 16 | 4.3 |
| EMP/13 - oap/3 | 14 | 3.8 |
| fdp/12 - oap/4 | 11 | 3.0 |
| 1990 | ||
| EMP/13 - oap/3 | 71 | 15.5 |
| INA/15 - oap/1 | 35 | 7.6 |
| EMP/14 - oap/2 | 28 | 6.1 |
| EMP/15 - oap/1 | 14 | 3.1 |
| fdp/13 - oap/3 | 13 | 2.8 |
| 2000 | ||
| EMP/13 - oap/3 | 54 | 14.0 |
| INA/15 - oap/1 | 26 | 6.7 |
| EMP/14 - oap/2 | 18 | 4.7 |
| EMP/15 - oap/1 | 18 | 4.7 |
| fdp/13 - oap/3 | 10 | 2.6 |
Table 3
Transition rates of cohort born in 1970, per cent.
| To | ||||||||||||
|---|---|---|---|---|---|---|---|---|---|---|---|---|
| From | bap | DEC | eop | EMP | fdp | INA | MIS | NA | oap | pdp | UNE | yos |
| bap | 97.0 | 1.5 | 0.0 | 0.0 | 0.0 | 0.0 | 1.5 | 0.0 | 0.0 | 0.0 | 0.0 | 0.0 |
| DEC | 0.0 | 100.0 | 0.0 | 0.0 | 0.0 | 0.0 | 0.0 | 0.0 | 0.0 | 0.0 | 0.0 | 0.0 |
| eop | 0.0 | 0.0 | 72.7 | 0.0 | 0.0 | 0.0 | 0.0 | 0.0 | 27.3 | 0.0 | 0.0 | 0.0 |
| EMP | 0.0 | 0.3 | 0.2 | 87.0 | 0.4 | 4.0 | 0.0 | 0.0 | 5.2 | 0.2 | 2.4 | 0.3 |
| fdp | 0.0 | 1.1 | 0.0 | 0.8 | 82.1 | 0.3 | 0.0 | 0.0 | 15.4 | 0.3 | 0.0 | 0.0 |
| INA | 0.0 | 0.5 | 0.1 | 1.2 | 5.3 | 77.9 | 0.0 | 0.0 | 11.9 | 0.1 | 2.8 | 0.0 |
| MIS | 16.7 | 6.7 | 0.0 | 0.0 | 0.0 | 0.0 | 73.3 | 0.0 | 0.0 | 0.0 | 3.3 | 0.0 |
| NA | 0.0 | 2.6 | 0.0 | 5.1 | 0.0 | 0.0 | 10.3 | 82.1 | 0.0 | 0.0 | 0.0 | 0.0 |
| oap | 0.0 | 0.5 | 0.0 | 0.0 | 0.0 | 0.0 | 0.0 | 0.0 | 99.5 | 0.0 | 0.0 | 0.0 |
| pdp | 0.0 | 0.0 | 0.0 | 0.0 | 4.8 | 2.4 | 0.0 | 0.0 | 16.7 | 76.2 | 0.0 | 0.0 |
| UNE | 0.0 | 0.6 | 1.6 | 14.9 | 0.0 | 6.3 | 0.3 | 0.0 | 10.8 | 0.0 | 65.4 | 0.0 |
| yos | 0.0 | 0.0 | 0.0 | 0.0 | 0.0 | 0.0 | 0.0 | 0.0 | 50.0 | 0.0 | 0.0 | 50.0 |
Table A2
ELSI model states.
| No. | Contents |
|---|---|
| 15 | Full-time employed for the first consecutive year |
| 16 | Full-time employed for the second consecutive year |
| 1 | Full-time employed for at least the third consecutive year |
| 2 | Unemployed (excluding those on an unemployment pathway to retirement) |
| 3 | On an unemployment pathway to retirement |
| 4 | Sickness benefits preceding full disability pension |
| 5 | Part-time pension |
| 11 | Partial old-age pension and employed |
| 10 | Partial disability pension and employed |
| 6 | Years-of-service pension |
| 7 | Partial old-age pension and not employed |
| 8 | Old-age pension |
| 17 | Full disability pension for the first consecutive year |
| 9 | Full disability pension for at least the second consecutive year |
| 18 | Partial disability pension and not employed |
| 21 | National old-age pension only |
| 22 | National disability pension only |
| 13 | Outside the labor force but has accrued earnings-related pension |
| 19 | Permanently outside the labor force but has accrued earnings-related pension |
| 20 | Outside the labor force and has not accrued earnings-related pension |
| 12 | Deceased |
Table A3
Labor market states of the cohort born in 1970 at ages 55 to 70, per cent.
| Labor market state | 55 | 56 | 57 | 58 | 59 | 60 | 61 | 62 | 63 | 64 | 65 | 66 | 67 | 68 | 69 | 70 |
|---|---|---|---|---|---|---|---|---|---|---|---|---|---|---|---|---|
| Basic pension | 1 | 1 | 1 | 1 | 1 | 1 | 1 | 1 | 1 | 1 | 1 | 1 | 2 | 2 | 2 | 2 |
| Deceased | 3 | 3 | 4 | 4 | 4 | 5 | 5 | 6 | 6 | 7 | 7 | 8 | 9 | 9 | 10 | 11 |
| Early OA pension | 0 | 0 | 0 | 0 | 0 | 0 | 0 | 0 | 2 | 3 | 3 | 2 | 1 | 0 | 0 | 0 |
| Employed | 69 | 67 | 67 | 65 | 64 | 61 | 59 | 56 | 44 | 37 | 35 | 14 | 5 | 2 | 1 | 0 |
| Full D pension | 5 | 5 | 6 | 6 | 7 | 8 | 10 | 11 | 13 | 15 | 15 | 0 | 0 | 0 | 0 | 0 |
| Inactive | 12 | 12 | 12 | 12 | 12 | 12 | 13 | 13 | 21 | 24 | 24 | 13 | 8 | 5 | 5 | 0 |
| Misfits | 1 | 1 | 1 | 1 | 1 | 1 | 1 | 1 | 1 | 1 | 1 | 0 | 0 | 0 | 0 | 0 |
| NA | 2 | 2 | 2 | 2 | 2 | 2 | 1 | 1 | 1 | 1 | 1 | 1 | 1 | 1 | 0 | 0 |
| OA pension | 0 | 0 | 0 | 0 | 0 | 0 | 0 | 0 | 0 | 0 | 1 | 61 | 75 | 81 | 82 | 87 |
| Part D pension | 0 | 0 | 0 | 1 | 1 | 1 | 1 | 1 | 1 | 1 | 1 | 0 | 0 | 0 | 0 | 0 |
| Unemployed | 8 | 8 | 8 | 8 | 8 | 9 | 10 | 10 | 10 | 10 | 10 | 0 | 0 | 0 | 0 | 0 |
| YoS pension | 0 | 0 | 0 | 0 | 0 | 0 | 0 | 0 | 0 | 1 | 1 | 0 | 0 | 0 | 0 | 0 |
| Total | 100 | 100 | 100 | 100 | 100 | 100 | 100 | 100 | 100 | 100 | 100 | 100 | 100 | 100 | 100 | 100 |
Data and code availability
Data and code have been provided to the journal and are available from its website.
Additional files
-
Supplementary file 1. Code and data
- http://web:8082/00218/IJM_00218_code_and_data.zip
Download links
A two-part list of links to download the article, or parts of the article, in various formats.