Global sensitivity analysis of a model simulating an individual’s health state through their lifetime
- UK Health Forum, United Kingdom
- Department of Public Health, Environments and Society, London School of Hygiene and Tropical Medicine, United Kingdom
Cite this article
as: A. Jaccard, L. Retat, M. Brown, L. Webber, Z. Chalabi; 2018; Global sensitivity analysis of a model simulating an individual’s health state through their lifetime; International Journal of Microsimulation; 11(3); 100-121.
doi: 10.34196/ijm.00190
- Article
- Figures and data
- Jump to
Figures
Figure 1

Schematic of the individual-based chronic disease model used to simulate individuals through time.
Source: The figure has been adapted from Lymer et al. (2016).
Figure 2

A graphical illustration of the first-order Sobol indices for each model input parameter: BMI, relative risk of stroke and relative risk of colorectal cancer for disease-free life expectancy.
Figure 3

A graphical illustration of the first-order Sobol indices for each model input parameter: BMI, relative risk of stroke and relative risk of colorectal cancer for life expectancy.
Figure 4

A graphical illustration of the first-order Sobol indices for each model input parameter: BMI, relative risk of stroke and relative risk of colorectal cancer for quality-adjusted life year.
Figure B.1
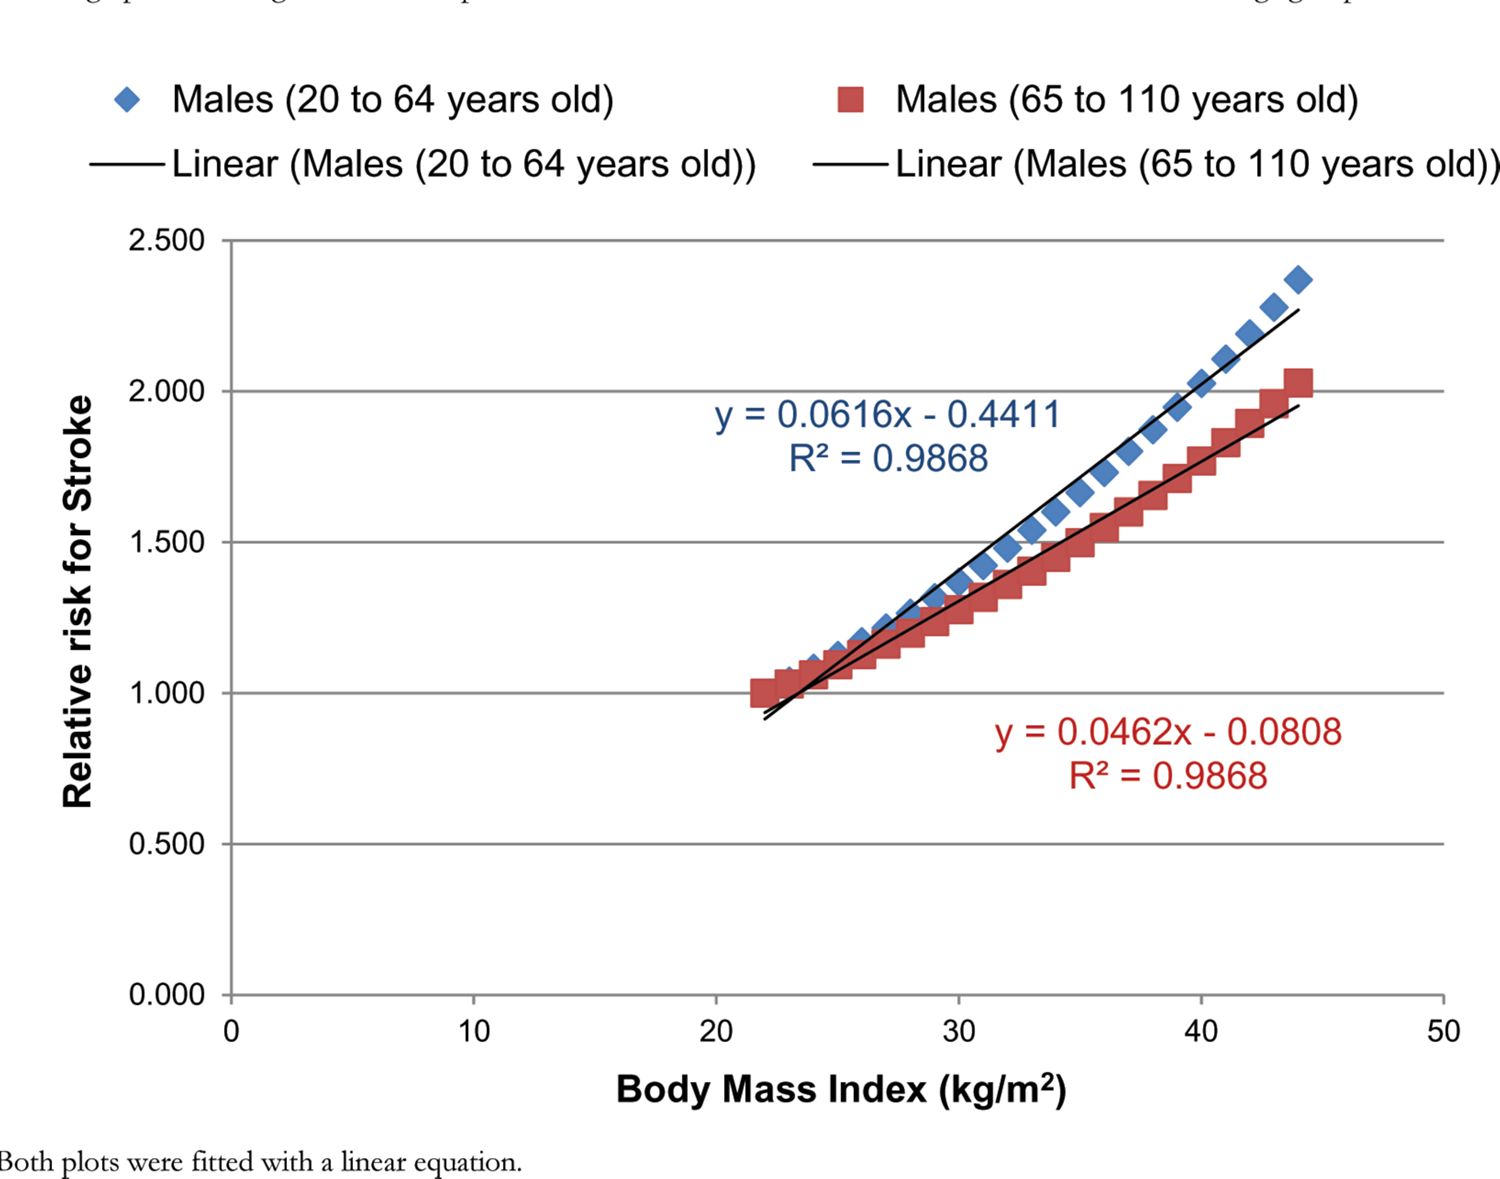
A graph illustrating the relationship between the RR for stroke and BMI for males for two different age groups.
Notes: Both plots were fitted with a linear equation.
Figure B.2

A graph illustrating the relationship between the RR for colorectal cancer and BMI for males for two different age groups.
Notes: Both plots were fitted with a linear equation.
Tables
Table 1
Summary of the BMI model parameters and their variances used in the sensitivity analysis.
| Model parameter | Mean | Standard deviation | Lower bound | Upper bound |
|---|---|---|---|---|
| Healthy weight BMI probability (BMI < 25 kg/m2) | 0.252 | 0.078 | 0.117 | 0.387 |
| Overweight BMI probability (25 ≤ BMI < 30 kg/m2) | 0.314 | 0.083 | 0.170 | 0.459 |
| Obese BMI probability (BMI ≥ 30 kg/m2) | 0.434 | 0.107 | 0.248 | 0.619 |
| Mean BMI category probability | 0.333 | 0.090 | 0.177 | 0.490 |
| Mean BMI1 level | 25.192 | 20.591 | 27.028 | |
| Case study 1 BMI level | 27.5 | 22.899 | 29.336 | |
| Case study 2 BMI level | 37.5 | 35.207 | 41.644 |
Table 2
Summary of the relative risk model parameters and their variances used in the sensitivity analysis.
| Model parameter | Mean | Standard deviation | Lower bound | Upper bound |
|---|---|---|---|---|
| Relative risk stroke for overweight | 1.213 | 0.056 | 1.116 | 1.310 |
| Relative risk stroke for obese | 1.758 | 0.107 | 1.573 | 1.944 |
| Relative risk colorectal cancer overweight for | 1.231 | 0.082 | 1.089 | 1.373 |
| Relative risk colorectal cancer obese for | 1.823 | 0.224 | 1.435 | 2.211 |
Table 3
Scalar additives z1, z2 and z3 sampled by PSUADE.
| PSUADE parameter | Lower bound for overweight | Upper bound for overweight | Lower bound for obese | Upper bound for obese |
|---|---|---|---|---|
| z1 | 22.899 | 29.336 | 35.207 | 41.644 |
| z2 | 1.116 | 1.310 | 1.573 | 1.944 |
| z3 | 1.089 | 1.373 | 1.435 | 2.211 |
Table 4
Summary of the mean, standard deviation and variance for the disease-free life expectancy for the two case studies.
| Case study | Mean (years) | Standard deviation (years) | Variance (years2) |
|---|---|---|---|
| Overweight male | 63.47 | 3.41 | 11.59 |
| Obese male | 48.32 | 3.14 | 9.87 |
Table 5
Summary of the mean, standard deviation and variance for the life expectancy for the two case studies.
| Case study | Mean (years) | Standard deviation (years) | Variance (years2) |
|---|---|---|---|
| Overweight male | 79.76 | 0.11 | 0.01 |
| Obese male | 79.17 | 0.31 | 0.09 |
Table 6
Summary of the mean, standard deviation and variance for the quality-adjusted life years for the two case studies.
| Case study | Mean (years) | Standard deviation (years) | Variance (years2) |
|---|---|---|---|
| Overweight male | 75.09 | 1.01 | 1.02 |
| Obese male | 70.06 | 1.06 | 1.12 |
Table C.1
Description of the categories used for the RF BMI.
| Risk factor (RF) | Number of categories (N) | Categories |
|---|---|---|
| BMI | 3 | BMI < 25 kg/m2 (normal weight) |
| BMI from 25 to 29.99 kg/m-2 (overweight) | ||
| BMI ≥ 30 kg/m2 (obesity) |
Download links
A two-part list of links to download the article, or parts of the article, in various formats.