Care&WorkMOD: An Australian microsimulation model projecting the economic impacts of early retirement in informal carers
-
Rupendra N Shrestha

-
Deborah Schofield
-
Melanie J B Zeppel
-
Michelle M Cunich
-
Robert Tanton
-
Simon J Kelly
-
Lennert Veerman
-
Megan E Passey
- Macquarie University, Australia
- The University of Sydney, Australia
- University of Canberra, Australia
- Griffith University, Australia
Cite this article
as: R. N Shrestha, D. Schofield, M. J B Zeppel, M. M Cunich, R. Tanton, S. J Kelly, L. Veerman, M. E Passey; 2018; Care&WorkMOD: An Australian microsimulation model projecting the economic impacts of early retirement in informal carers; International Journal of Microsimulation; 11(3); 78-99.
doi: 10.34196/ijm.00189
- Article
- Figures and data
- Jump to
Figures
Figure 1

Structure of Care&WorkMOD.
Figure 2

Informal carers by age and sex (SDAC, 2012).
Figure 3
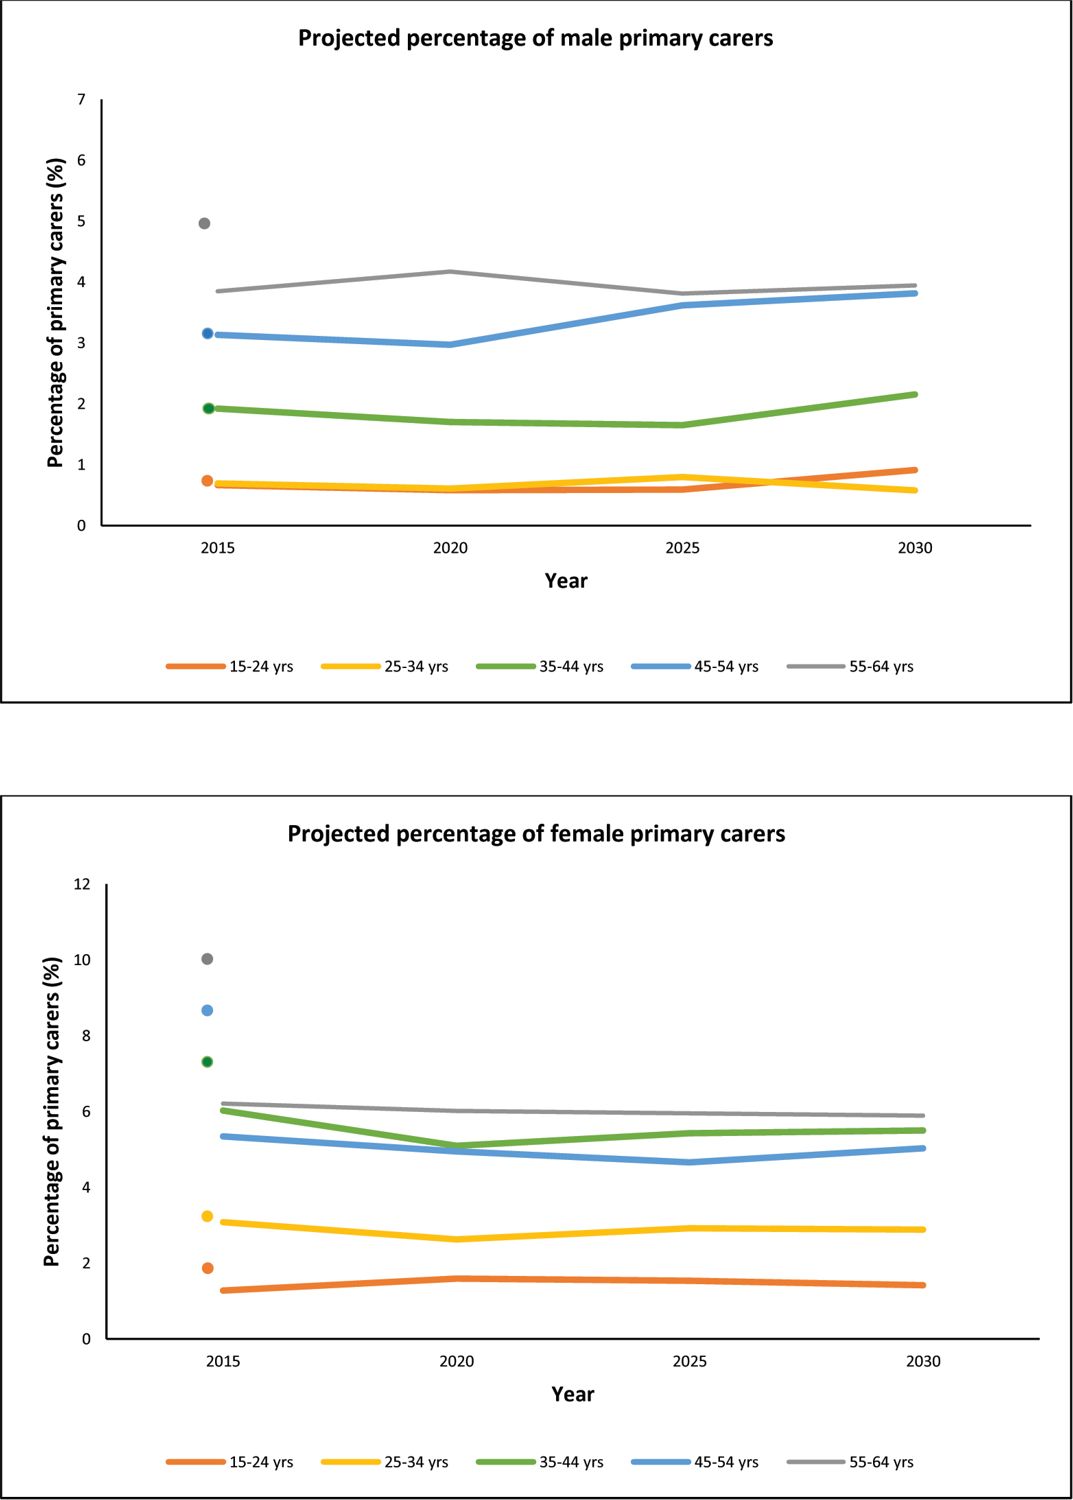
Projected percentages of primary informal carers among the total population by age group and sex, 2015–2030. Dots represent the SDAC estimates for 2015.
Note: For males 15–24 and 25–35 both values are 1%.
Figure 4

Percentages of matched records by the number of matching variables.
Tables
Table 1
Synthetic matching variables and their categories in Care&WorkMOD.
| Matching variables | Categories |
|---|---|
| Group A | |
| Labour force status | Employed full-time |
| Employed part-time | |
| Unemployed looking for work | |
| Not in the labour force | |
| Income unit type | Married couple with dependents |
| Married couple only | |
| One parent with dependents | |
| One person | |
| Income quintile | 1st quintile |
| 2nd quintile | |
| 3rd quintile | |
| 4th quintile | |
| 5th quintile | |
| Sex | Male |
| Female | |
| Age group | 15–19 years |
| 20–24 years | |
| 25–29 years | |
| 30–34 years | |
| 35–39 years | |
| 40–44 years | |
| 45–49 years | |
| 50–54 years | |
| 55–59 years | |
| 60–64 years | |
| Group B | |
| Hours worked per week | Not applicable |
| 1–15 hours | |
| 16–24 hours | |
| 25–34 hours | |
| 35–40 hours | |
| 41+ hours | |
| Highest level of educational qualification | University |
| Non-university | |
| Home ownership | Yes |
| No | |
| Receiving Carer Payment | Yes |
| No |
Table 2
Error rates in synthetic matching by matching variables.
| Matching variables | No of SDAC records matched with STINMOD record of different category | % |
|---|---|---|
| Labour force status | 0 | 0.0% |
| Income unit type | 0 | 0.0% |
| Income quintiles | 6 | 0.0% |
| Sex | 135 | 0.1% |
| Age group | 3217 | 2.9% |
| Hours worked per week | 1007 | 0.9% |
| Highest level of education | 344 | 0.3% |
| Home ownership | 308 | 0.3% |
| Receiving carer payment | 395 | 0.4% |
Download links
A two-part list of links to download the article, or parts of the article, in various formats.