Increasing the impact of dynamic microsimulation modelling
- National University of Ireland, Ireland
- Federal Planning Bureau, Belgium
- Centre for Sociological Research (CESO), KU Leuven, Belgium
Cite this article
as: C. O’Donoghue, G. Dekkers; 2018; Increasing the impact of dynamic microsimulation modelling; International Journal of Microsimulation; 11(1); 61-96.
doi: 10.34196/ijm.00174
- Article
- Figures and data
- Jump to
Figures
Figure 1
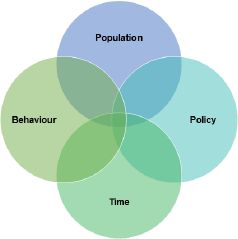
Complexity in dynamic microsimulation models – inter-temporal microsimulation models.
Tables
Table 1
Proportion of articles published in different formats 2013+.
| Journal | Mimeo | Book | Conference Proceedings |
|---|---|---|---|
| 0.67 | 0.16 | 0.09 | 0.07 |
-
Source: Google Scholar.
Table 2
Share of articles by application area 2013+.
| Application Area | Share of Papers |
|---|---|
| Labour Market | 0.23 |
| Education | 0.03 |
| Wealth | 0.04 |
| Income Distribution & Social Protection | 0.03 |
| Pensions | 0.13 |
| Health | 0.18 |
| Elderly Care | 0.07 |
| Demography | 0.14 |
| Energy, Environment and Land Use | 0.10 |
| Spatial | 0.04 |
-
Source of bibliographic analysis: Google Scholar.
Table 3
Progress achieved.
| Classification in Hoschka (1986)4 | Achievement |
|---|---|
| Behaviour | Better Micro-Econometrics, albeit often limited to comparative statics. |
| Access to Data | Vastly improved access, especially in administrative data; although some reversals in survey panel data. |
| Model Development | Development of open-source microsimulation platforms with shared models (MODGEN, LIAM2, JAS-mine, FEM). |
| Computer Hardware | Huge improvements. |
| Policy Areas | New policy areas, e.g. “health microsimulation”. |
| Validation | About 10% of the investment time in developing a dynamic microsimulation model is taken up by the actual construction, the remaining 90% is validation (Caldwell & Morrison, 2000). |
| Complexity | Constant struggle. |
Table 4
Who are the participants in world congresses of microsimulation?
| World Congress | Research | University | Government | Private Sector |
|---|---|---|---|---|
| Turin | 21% | 54% | 21% | 4% |
| Canberra | 20% | 42% | 34% | 4% |
-
Source: Google Scholar.
Table 5
Where to next?
| Classification in Hoschka (1986) | Requirement |
|---|---|
| Behaviour | Still too little focus on causality. However much of existing literature is not possible to extrapolate. |
| Access to Data | Era of big data: how to utilise? |
| Model Development | What are the best methods to use? The need for more methodological research. |
| Computer Hardware | Cloud computing. |
| Policy Areas | Big global questions like impact of climate change and greater market risk; other policy areas. |
| Validation | Confidence intervals and Monte Carlo. |
| Complexity | Constant trade-off. |
Download links
A two-part list of links to download the article, or parts of the article, in various formats.