Projected population, inequality and social expenditures: The Case of Flanders
- KU Leuven, Belgium
- Vrije Universiteit Brussel, Belgium
Cite this article
as: R. De Blander, I. Schockaert, A. Decoster, P. Deboosere; 2017; Projected population, inequality and social expenditures: The Case of Flanders; International Journal of Microsimulation; 10(3); 92-133.
doi: 10.34196/ijm.00167
- Article
- Figures and data
- Jump to
Figures
Figure 1
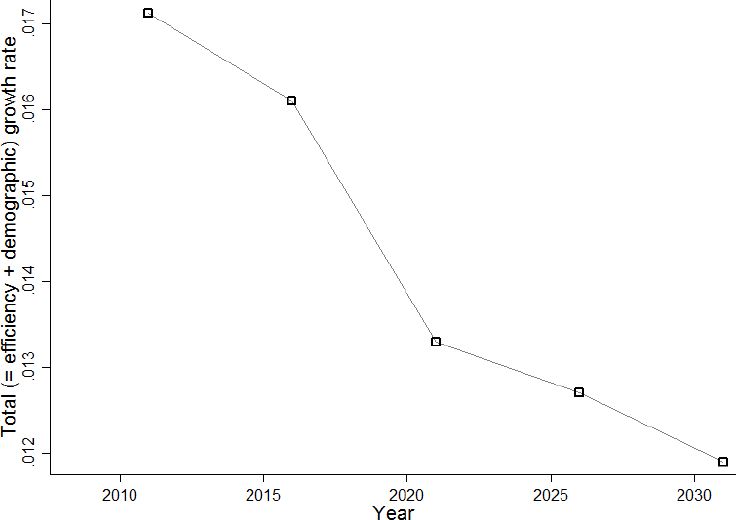
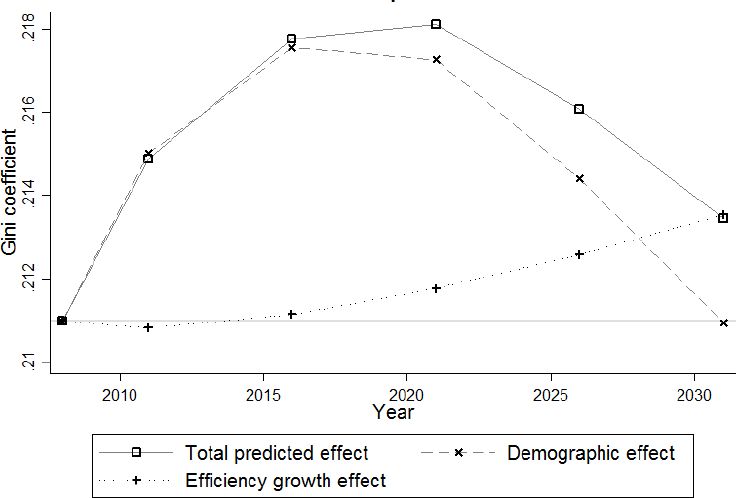
The macro-economic growth rate resulting from both effciency and demographic growth.
Figure 2
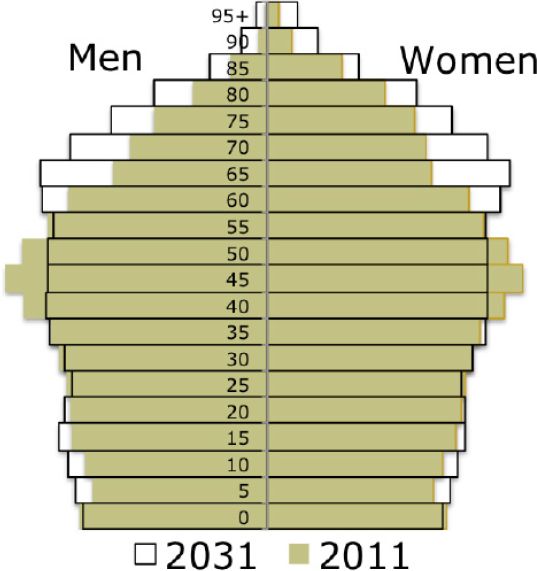
Population pyramid 2011 – 2031.
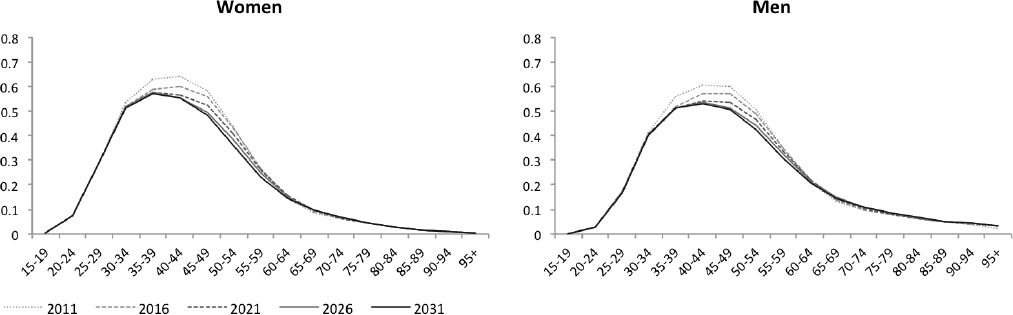
Figure 3

Couples with children by age and sex.
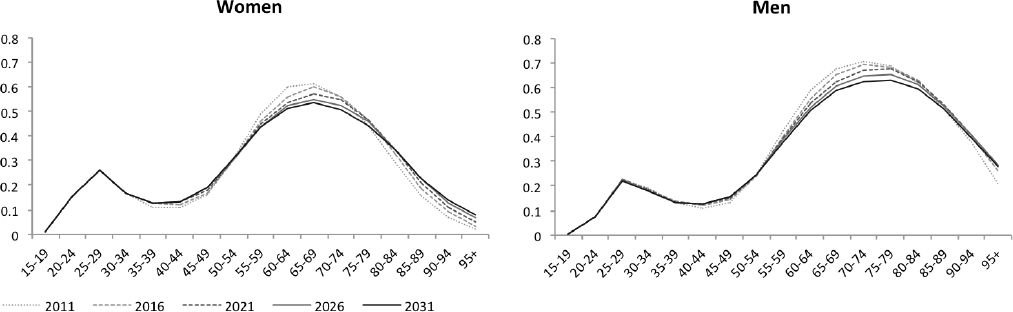
Figure 4

Couples without children by age and sex.
Figure 5

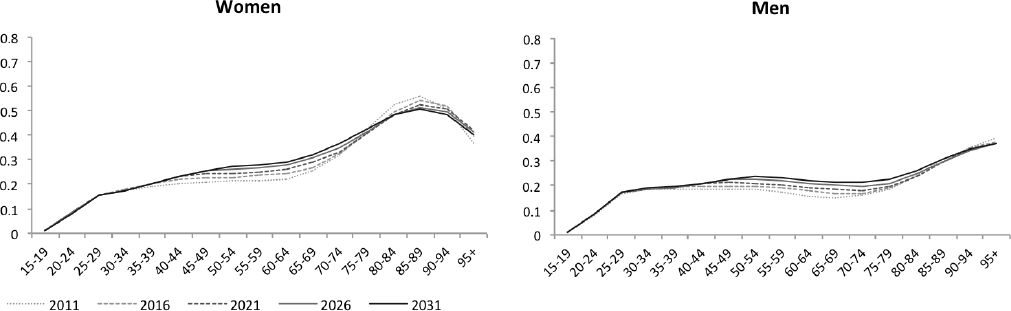
Single-headed household-heads by age and sex.
Figure 6
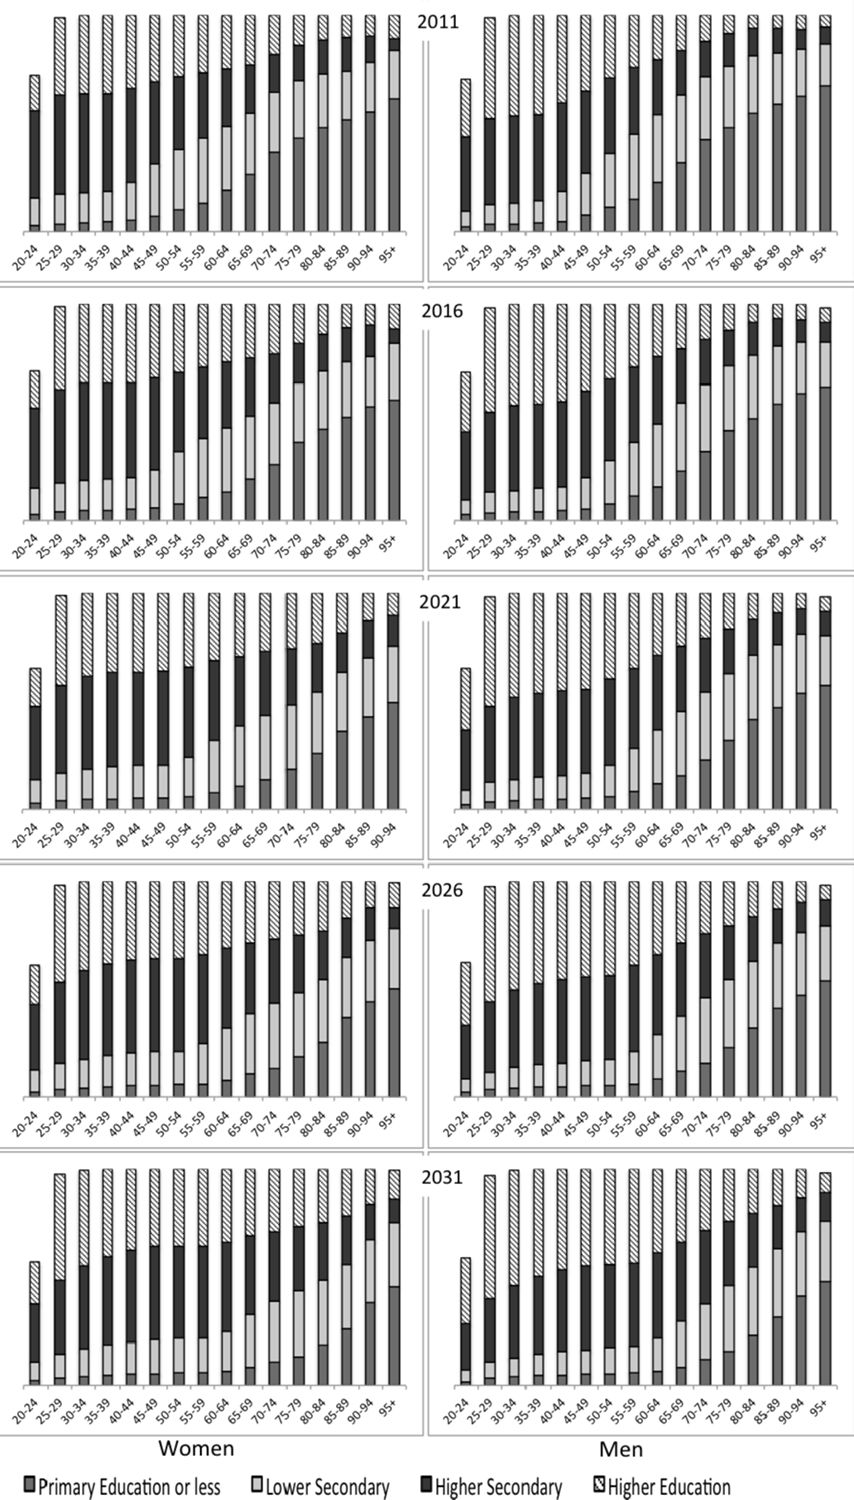
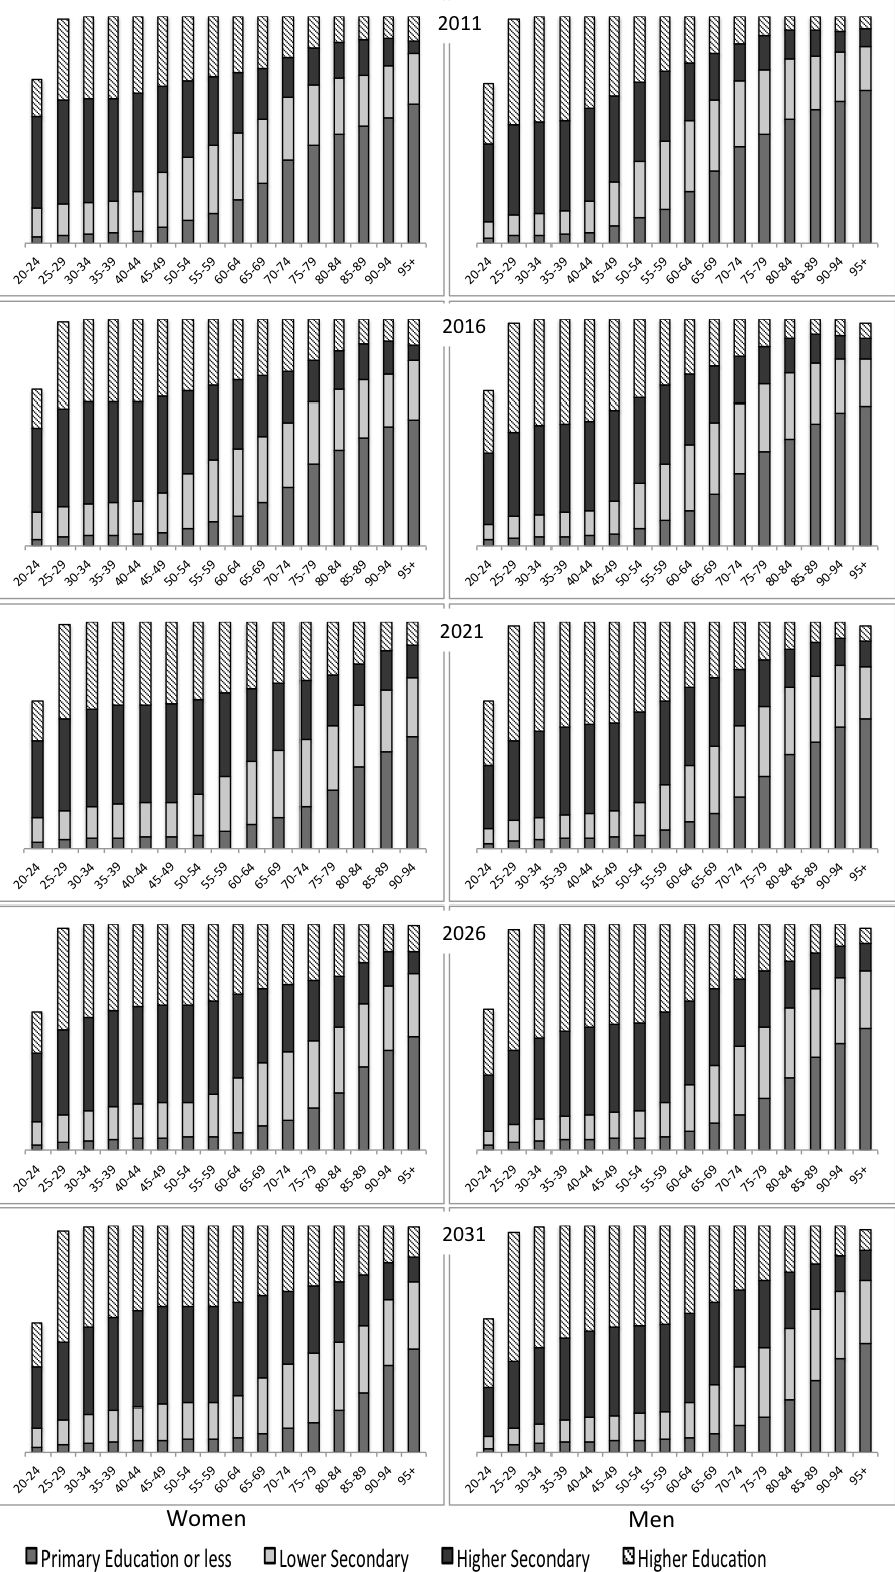
Population and educational attainment by age and sex.
Figure 7

Inequality measure: Gini coefficient.
Figure 8
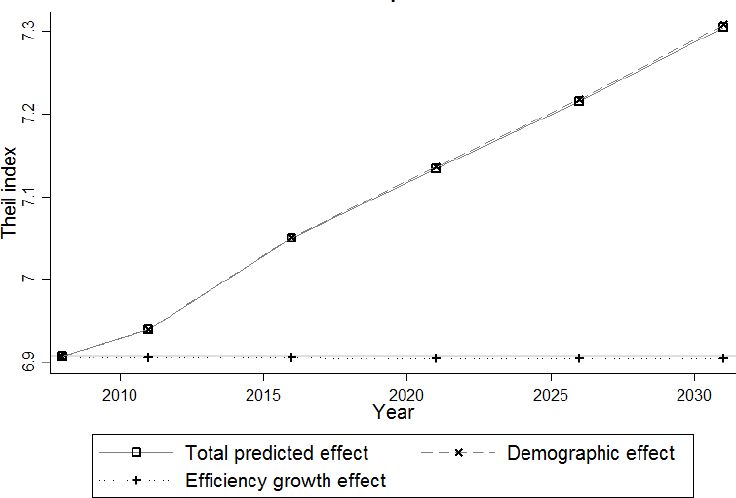

Inequality measure: Theil index.
Figure 9
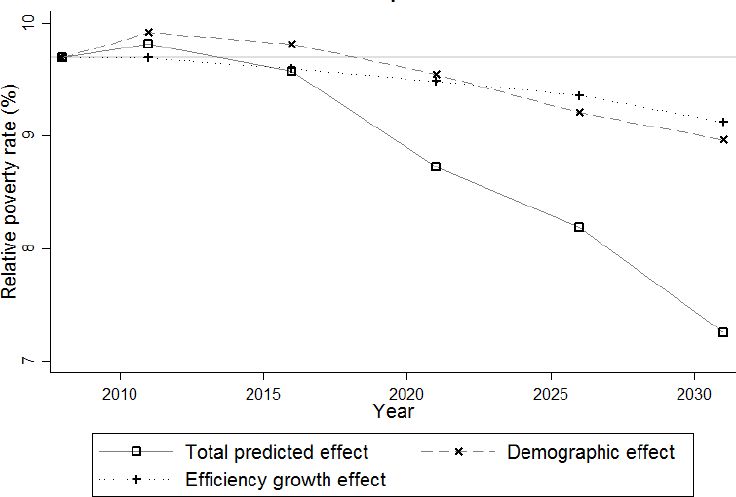

Relative poverty rate.
Figure 10
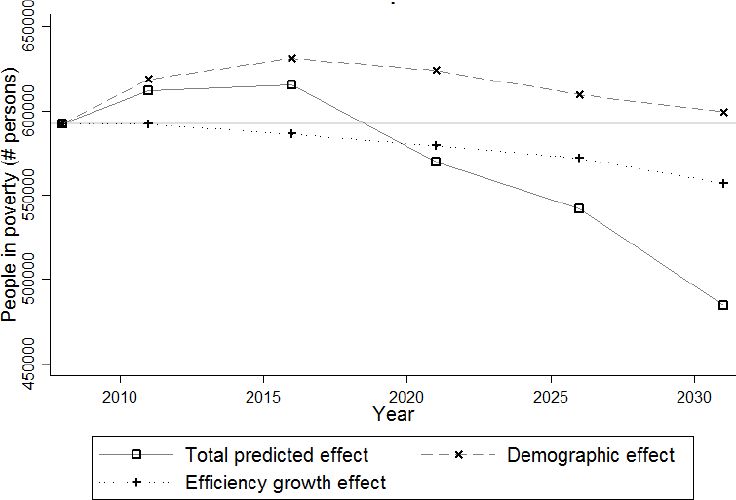

People in poverty.
Figure 11
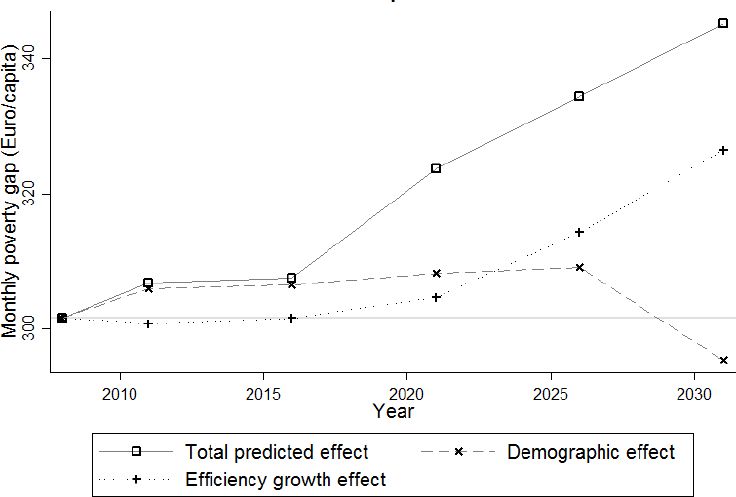
Monthly poverty gap per poor household.
Figure 12

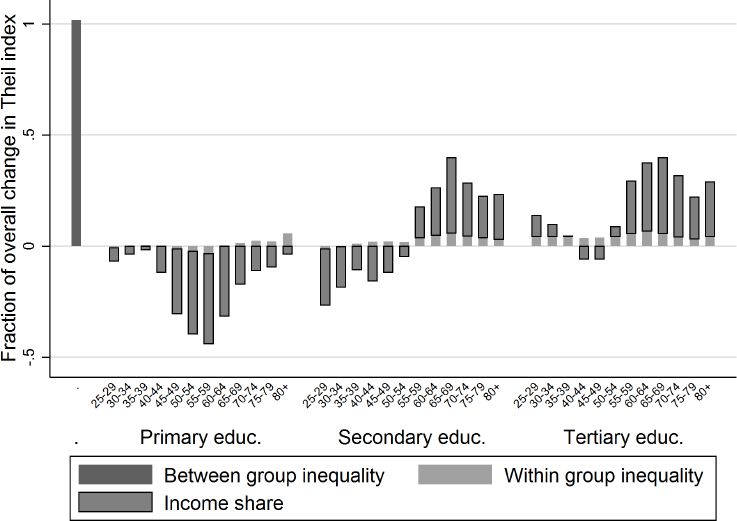
Decomposition of the change in Theil index with respect to sub-populations by age and educational attainment, period 2011–2031.
Figure 13
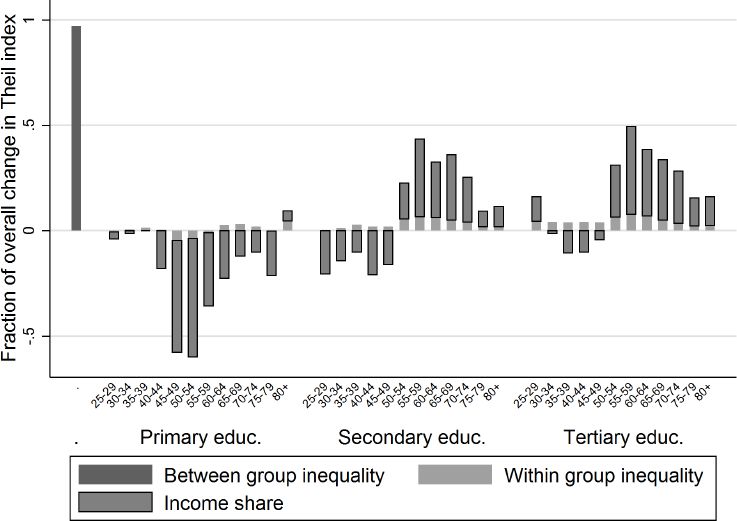
Decomposition of the change in Theil index with respect to sub-populations by age and educational attainment, period 2011–2021.
Figure 14
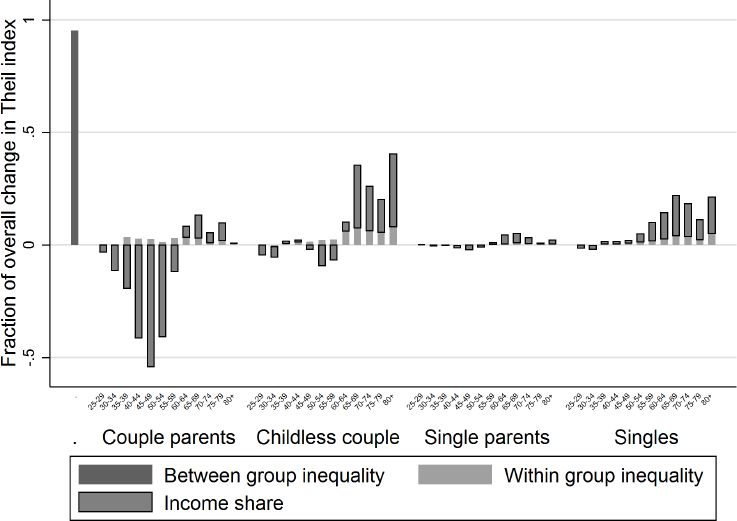
Decomposition of the change in Theil index with respect to sub-populations by age and household position, period 2011–2031.
Figure 15

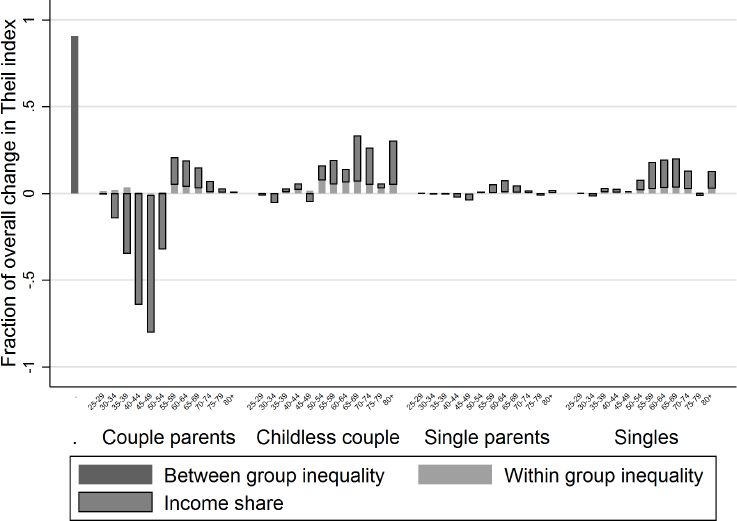
Decomposition of the change in Theil index with respect to sub-populations by age and household position, period 2011–2021.
Figure 16

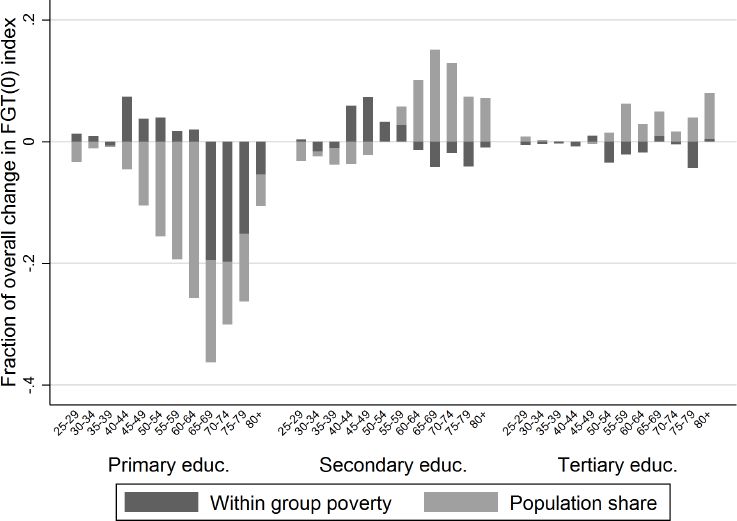
Decomposition of poverty change by age and educational attainment.
Figure 17

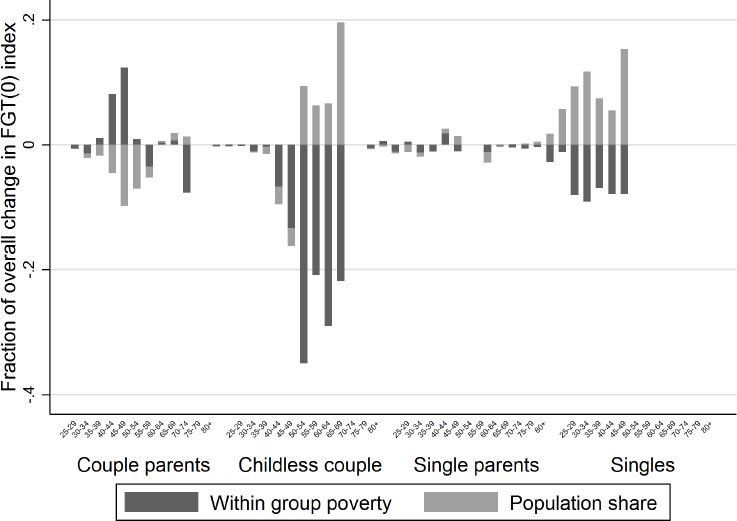
Decomposition of poverty change by age and household position.
Figure 18

Evolution of income taxes and social security contributions as a percentage of total income.
Figure 19
Evolution of all social security payments received as a percentage of total income.
Figure 20

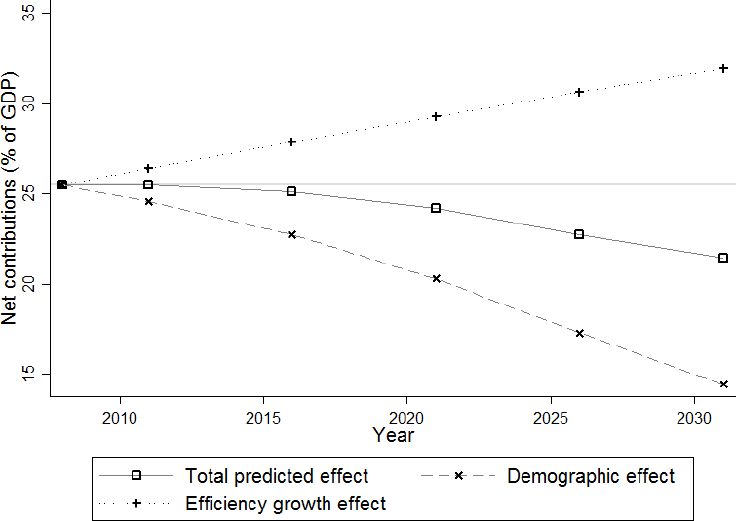
Net yearly payments made.
Figure 21
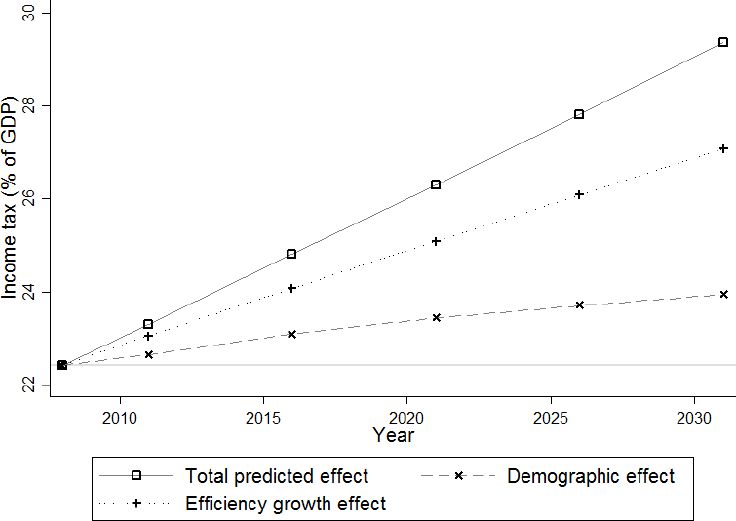
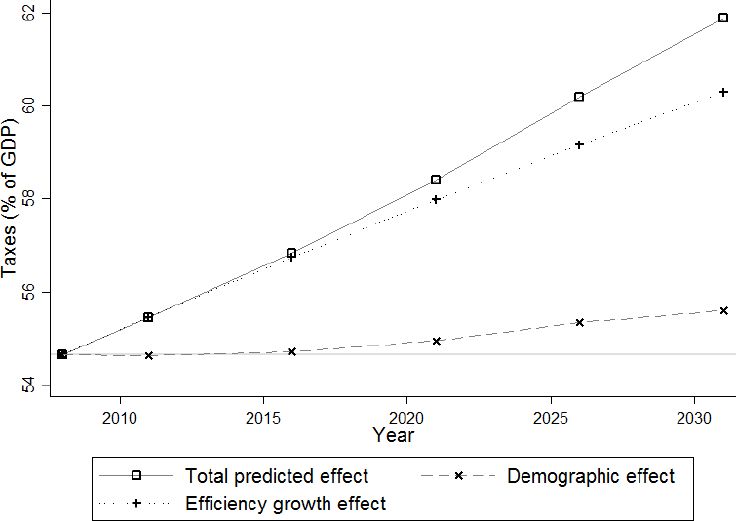
Evolution of income taxes.
Figure 22

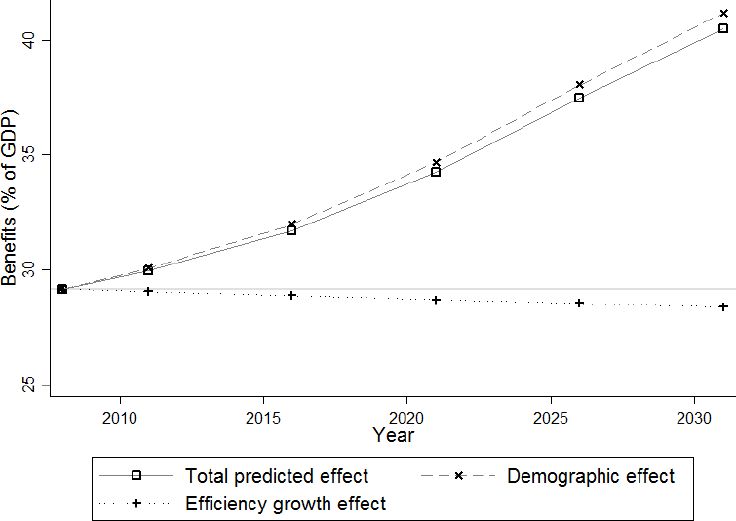
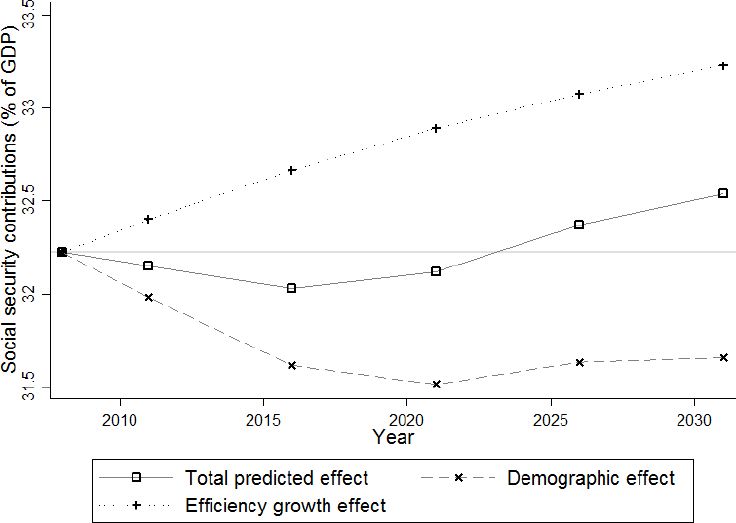
Evolution of social security contributions.
Figure 23
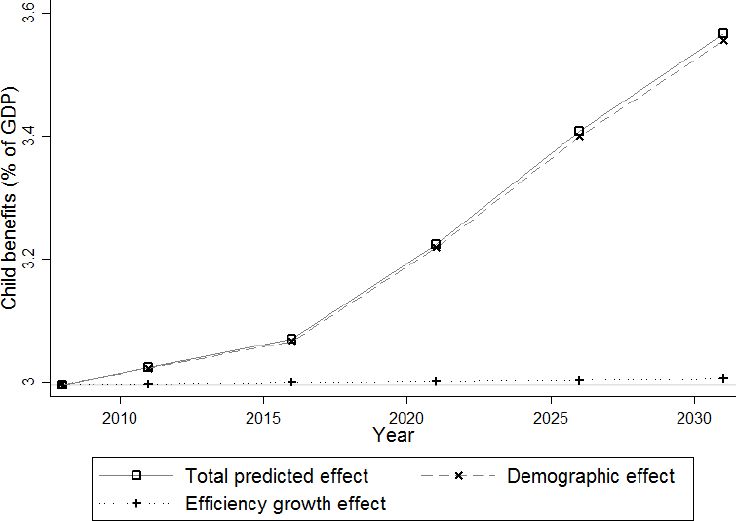
Evolution of different types of child support.
Figure 24
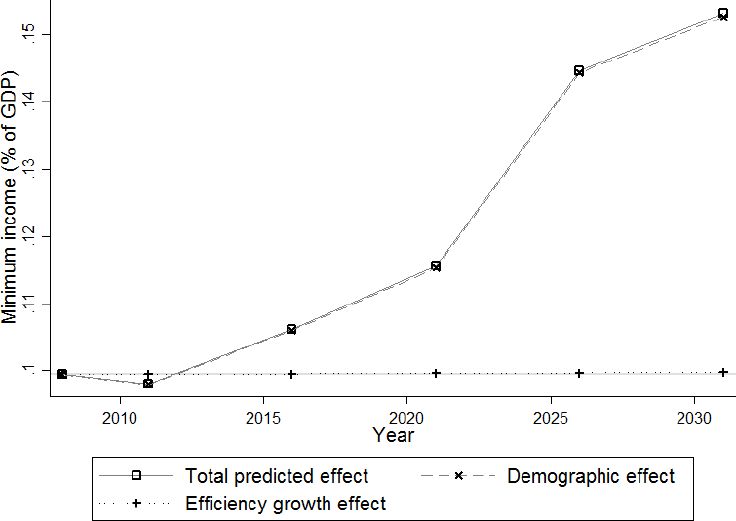

Evolution of minimum income.
Figure 25
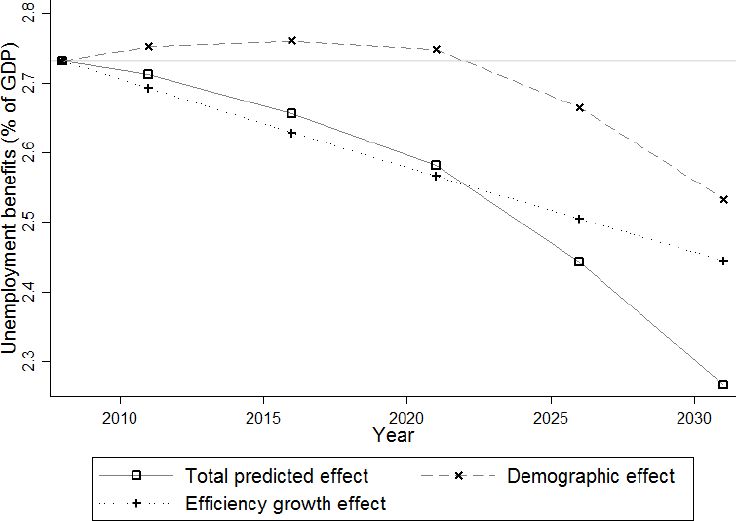
Evolution of Unemployment benefits.
Figure 26
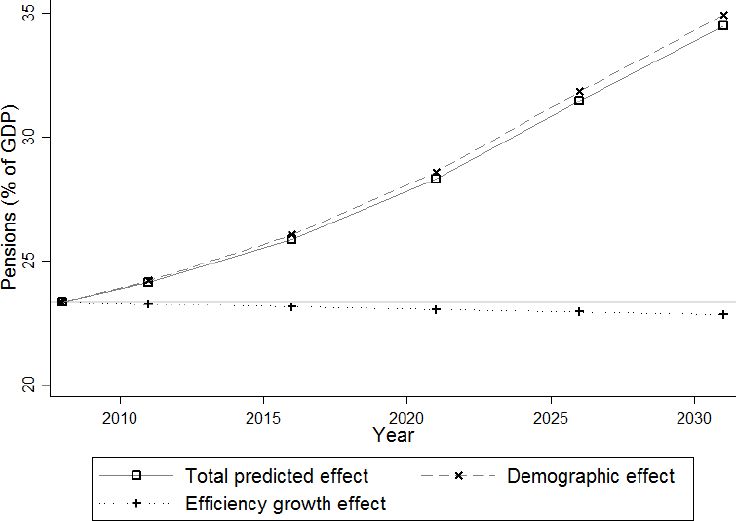

Evolution of Pensions.
Figure A.1
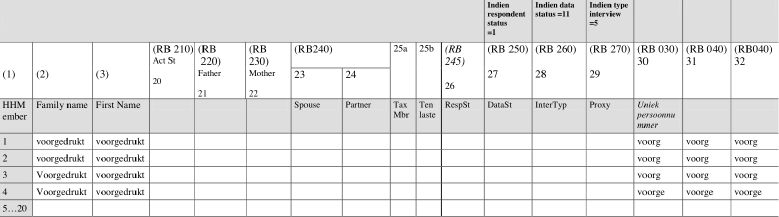
The EU-SILC questionnaire on relationships among household members.
Notes: Note that “voorgedrukt” and “voorg” means that the information is taken directly from the National Register. The interviewer only verifies it. Source: National Register of Belgium.
Figure A.2

Comparison of the population distribution by age and sex in EU-SILC and the projection, SING, MAR0, MAR+.
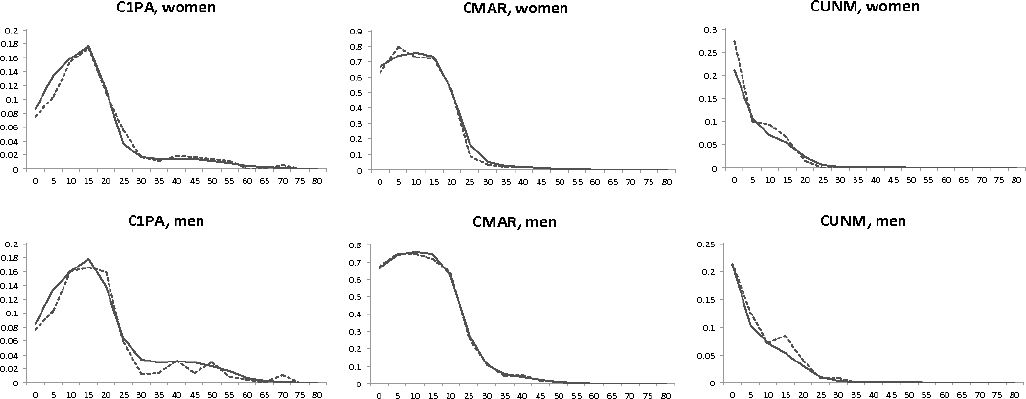
Figure A.3
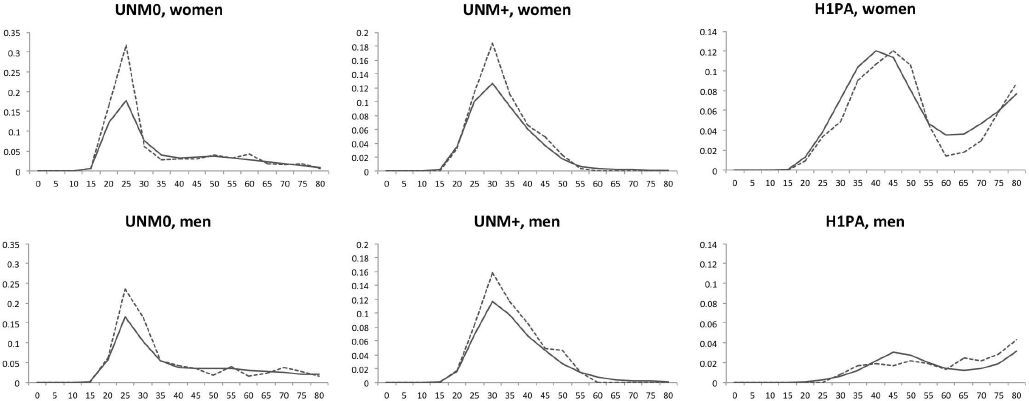

Comparison of the population distribution by age and sex in EU-SILC and the projection, UNM0, UNM+, H1PA.
Tables
Table 1
Projection scenarios.
| Period | ||||||
|---|---|---|---|---|---|---|
| 2006–10 | 2011–15 | 2016–20 | 2021–25 | 2026–30 | ||
| Fertility (births per woman) | 1.73 | 1.82 | 1.76 | 1.72 | 1.70 | |
| Life expectancy (years) | Female | 82.7 | 83.2 | 83.8 | 84.4 | 85.0 |
| Male | 76.9 | 77.7 | 78.7 | 79.6 | 80.7 | |
| Net migration (rate/base rate) | 1 | 1.2 | 1.4 | 1.2 | 1 | |
| Educat. retent. (rate/base rate) | 1 | 1.065 | 1.13 | 1.195 | 1.25 | |
Table 2
Up-rate factors.
| year | factor |
|---|---|
| 2011 | 1.030 |
| 2016 | 1.083 |
| 2021 | 1.138 |
| 2026 | 1.196 |
| 2031 | 1.257 |
Table A.1
Rules for creating a LIPRO-typology in EU-SILC.
| SING | only individual living in the household |
| H1PA | someone’s parent and without partner |
| MAR0 | married with partner and not someone’s parent |
| MAR+ | married with partner and is someone’s parent |
| UNM0 | someone’s partner (one of both unmarried) and not someone’s parent |
| UNM+ | someone’s partner (one of both unmarried) and someone’s parent |
| CMAR | has a parent with a partner, both are married |
| CUNM | has a parent with a partner, one of both is unmarried currently married |
| C1PA | has a parent without partner |
| OTHR or NFR | All other positions |
| COLL | Collective households are excluded from EU-SILC |
Download links
A two-part list of links to download the article, or parts of the article, in various formats.