Intertemporal income in Ireland 1996–2011 – a spatial analysis
- National Centre for Geocomputation, Maynooth University, Ireland
- Teagasc Rural Economy and Development Programme, Mellows Campus, Ireland
- Institute Department of Geography, Maynooth University, Ireland
Cite this article
as: P. Kilgarriff, C. O’Donoghue, M. Charlton, R. Foley; 2016; Intertemporal income in Ireland 1996–2011 – a spatial analysis; International Journal of Microsimulation; 9(2); x-y.
doi: 10.34196/ijm.00138
- Article
- Figures and data
- Jump to
Figures
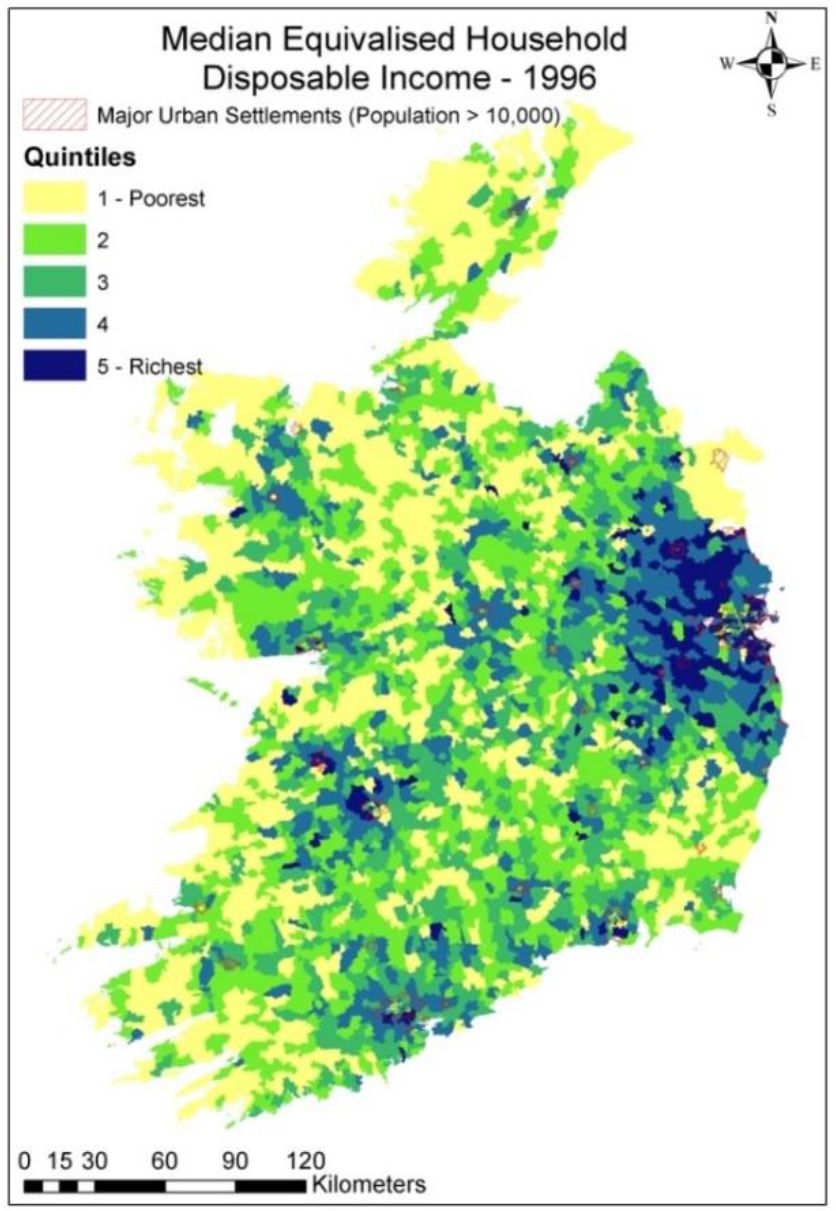
Figure 1

Disposable income – 1996.
Source: Author calculations.
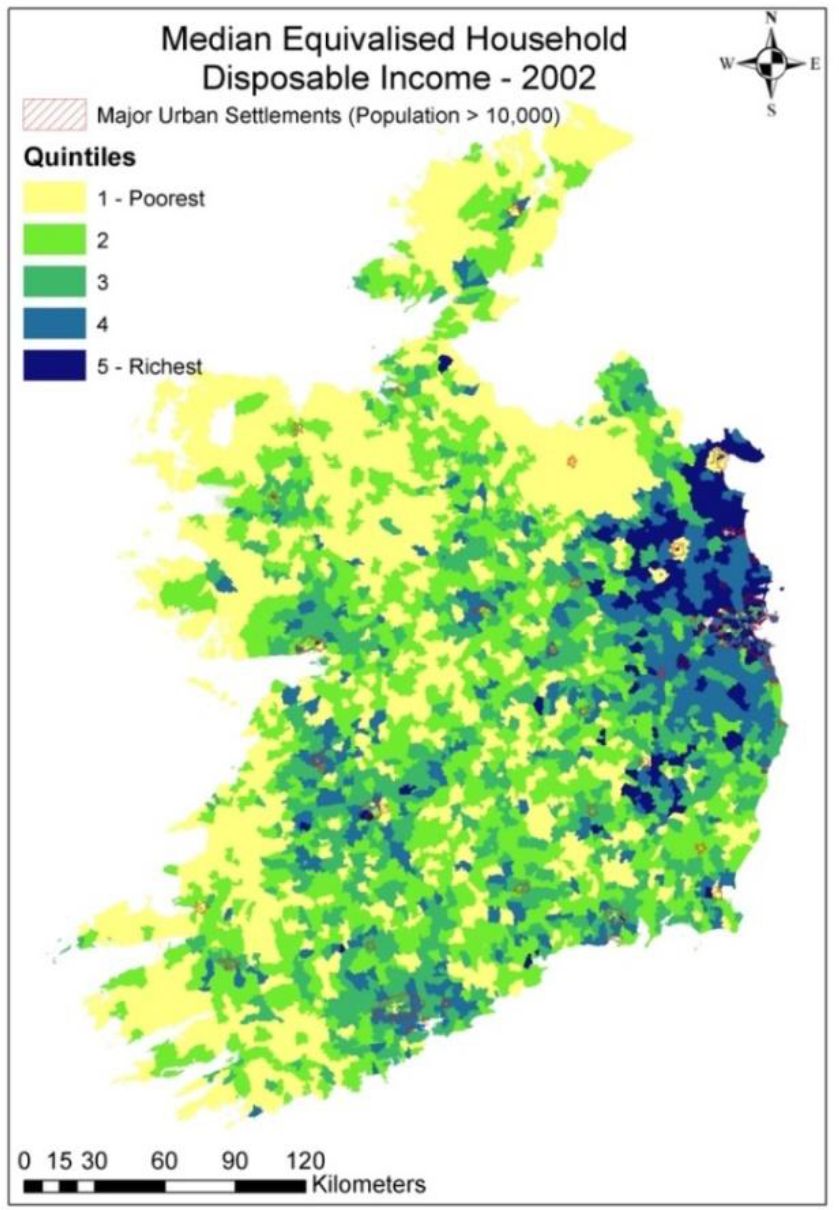
Figure 2

Disposable income – 2002.
Source: Author calculations.
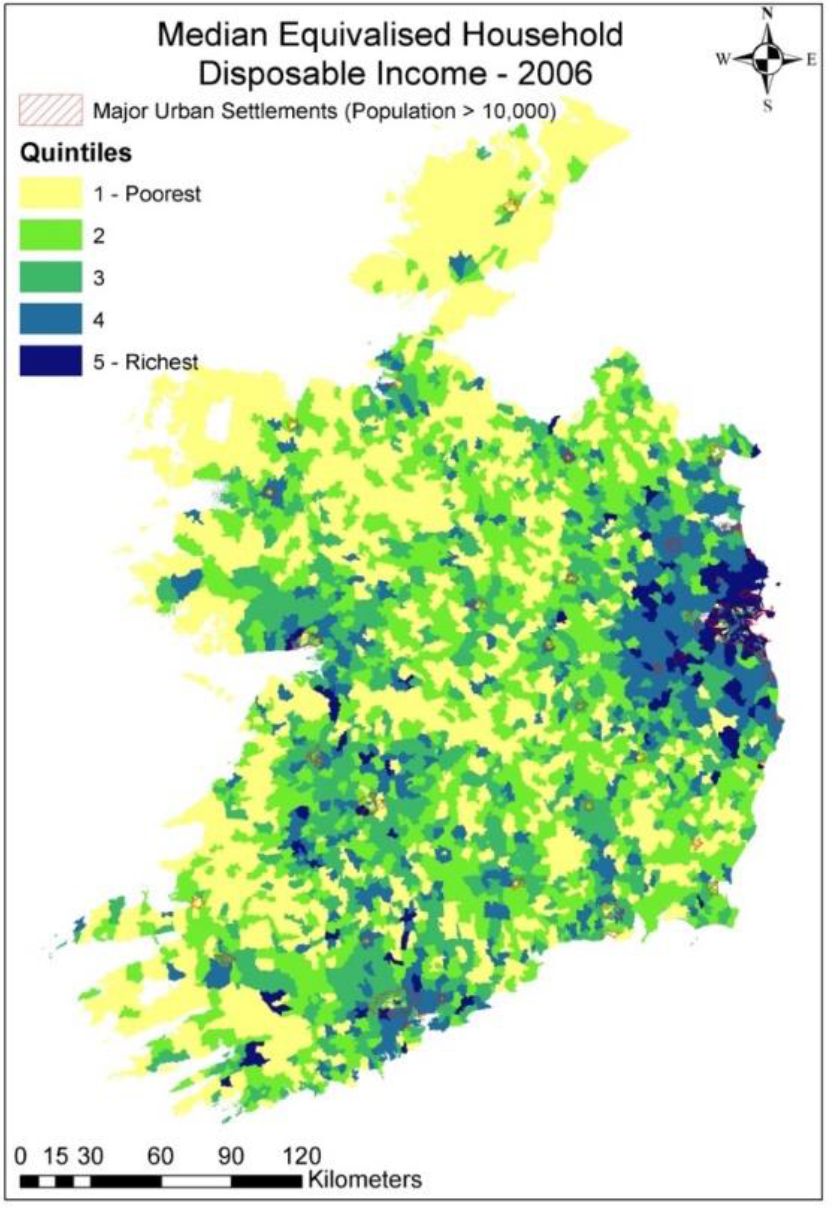
Figure 3

Disposable income – 2006.
Source: Author calculations.
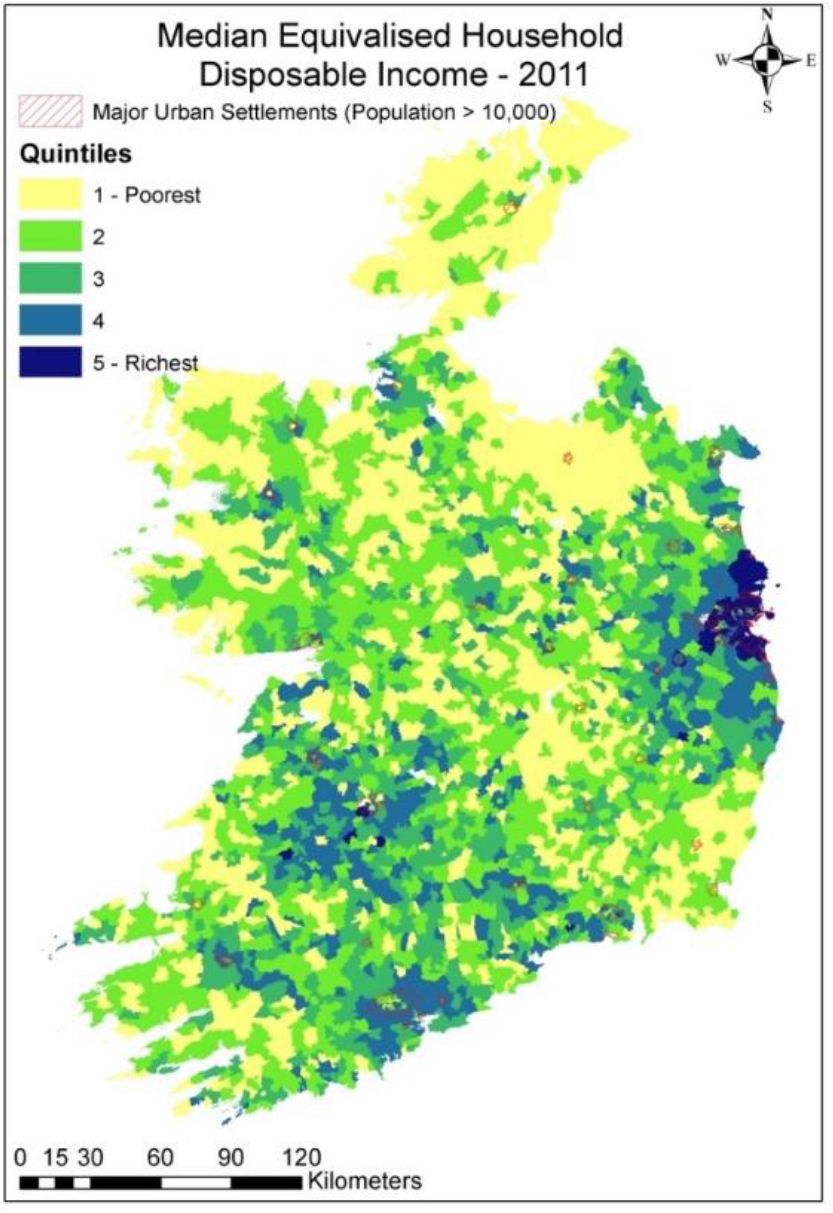
Figure 4

Disposable income – 2011.
Source: Author calculations.
Figure 5
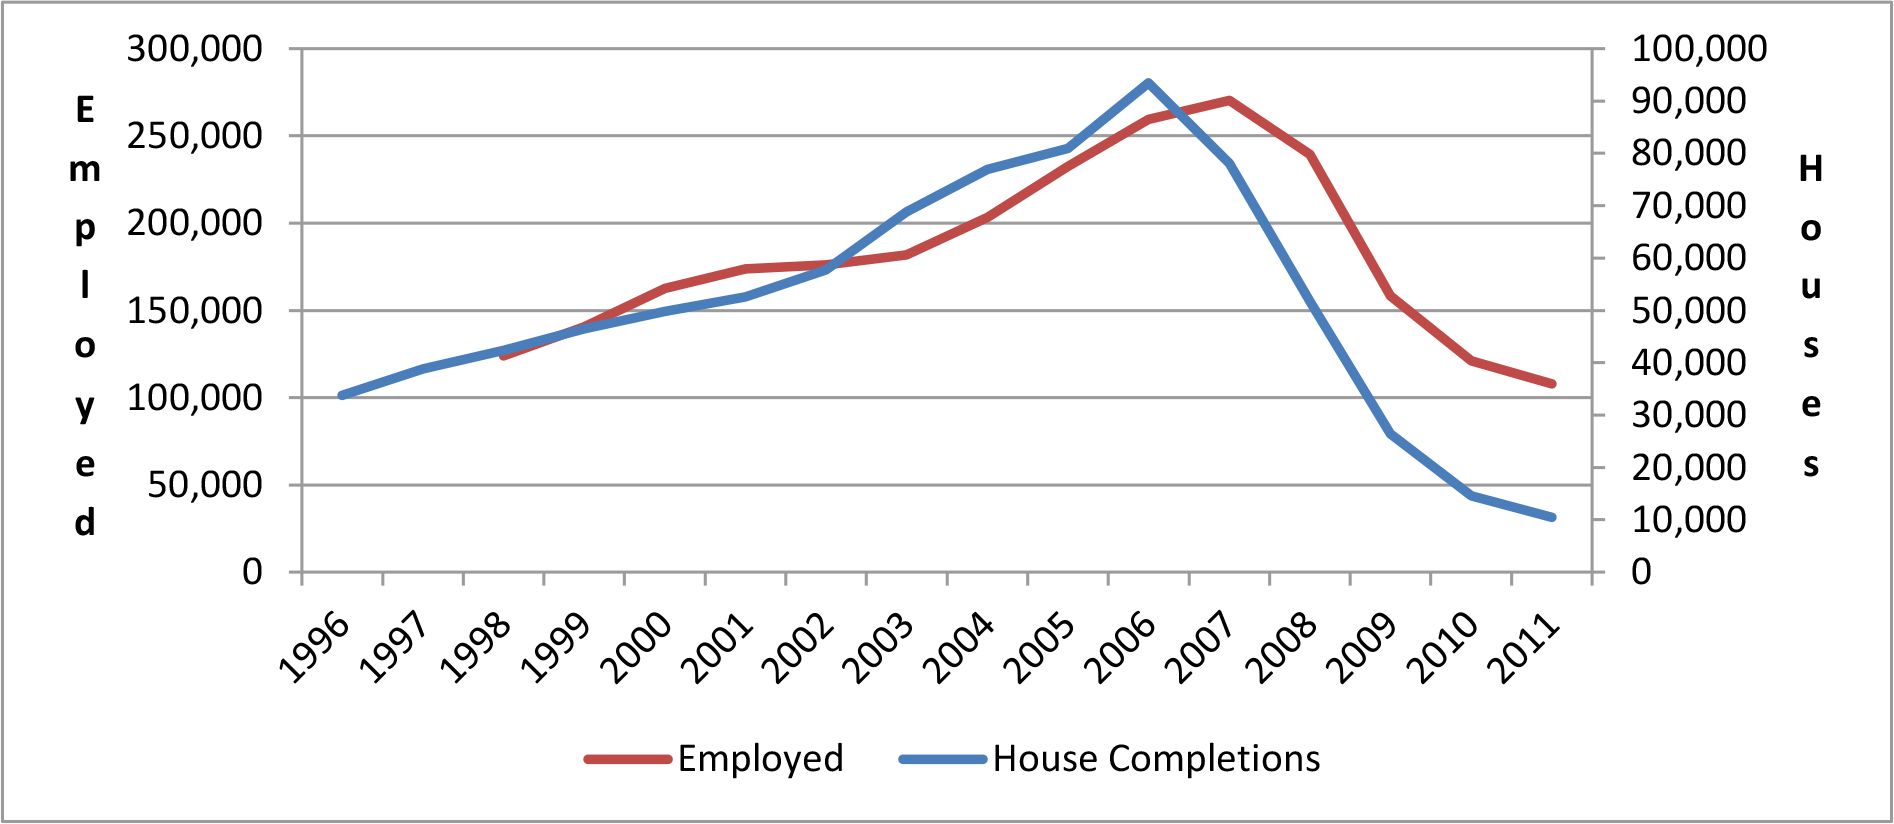

Employment in construction versus house completions.
Source: DECLG & CSO.
Tables
Table 1
Sensitivity analysis (using 2011 data) – quintile movers.
| Moved | Education | Labour-force | Employment-rate |
|---|---|---|---|
| −4 | 0% | 1% | 0% |
| −3 | 4% | 5% | 4% |
| −2 | 7% | 10% | 9% |
| −1 | 17% | 17% | 18% |
| 0 | 41% | 33% | 36% |
| 1 | 20% | 20% | 20% |
| 2 | 8% | 10% | 9% |
| 3 | 2% | 4% | 3% |
| 4 | 0% | 1% | 0% |
-
Source: Author Calculations.
Table 2
Urban-rural classification breakdown.
| 1996 Persons | 2011 Persons | %Pop. 1996 | %Pop.2011 | |
|---|---|---|---|---|
| Rural | 628,359 | 791,644 | 17% | 17% |
| Village (200 – 1499- | 521,362 | 688,238 | 14% | 15% |
| Town (1500 – 2999) | 188,491 | 275,295 | 5% | 6% |
| Town (3000 – 4999) | 101,105 | 137,648 | 3% | 3% |
| Town (5000 – 9999) | 209,719 | 321,178 | 6% | 7% |
| Town (1000 +) | 704,805 | 734,120 | 19% | 16% |
| Waterford * | 44,009 | 45,883 | 1% | 1% |
| Galway | 59,456 | 91,765 | 2% | 2% |
| Limerick | 57,107 | 45,883 | 2% | 1% |
| Cork | 179,425 | 183,530 | 5% | 4% |
| Dublin County | 386,033 | 527,612 | 10% | 11% |
| Dublin City | 676,093 | 745,457 | 18% | 16% |
-
Source: Author Calculations.
-
*
Waterford, Galway, Limerick and Cork only include EDs inside the city boundary.
Table 3
Quintile cross-tab (in 2011 population %).
| 1996 | |||||||
|---|---|---|---|---|---|---|---|
| 1 | 2 | 3 | 4 | 5 | TOTAL | ||
| 2011 | 1 | 42% | 37% | 14% | 7% | 0% | 100% |
| 2 | 16% | 32% | 35% | 15% | 2% | 100% | |
| 3 | 14% | 16% | 29% | 29% | 12% | 100% | |
| 4 | 9% | 9% | 21% | 38% | 23% | 100% | |
| 5 | 1% | 3% | 5% | 22% | 70% | 100% | |
| TOTAL | 83% | 96% | 104% | 110% | 106% | ||
-
Source: Author Calculations.
Table 4
House completions by year.
| Year | Completions |
|---|---|
| 1996 | 33,325 |
| 2002 | 57,295 |
| 2006 | 93,019 |
| 2011 | 10,480 |
-
Source: DECLG.
Table 5
Quintile characteristics.
| 1996 | 2011 | Movers (quintiles) | ||||
|---|---|---|---|---|---|---|
| Q1 | Q5 | Q1 | Q5 | Down 2 + | Up 2 + | |
| Disposable income * | €5,869 | €10,042 | €15,615 | €25,960 | €18,178 | €20,261 |
| Youth deprivation | 25.9% | 23.2% | 16.3% | 10.4% | 15.6% | 14.9% |
| Old Age Deprivation | 15.8% | 10.7% | 16.5% | 15.7% | 15.7% | 14.9% |
| University Educated | 21.3% | 35.6% | 32.5% | 47.1% | 36.1% | 37.6% |
| Employment Share | 40.7% | 48.6% | 49.3% | 56.4% | 51.0% | 52.0% |
| Unemployment share | 8.9% | 6.8% | 12.3% | 10.7% | 11.8% | 11.7% |
| Pop Density | 490.6 | 2226.5 | 251.2 | 3379.9 | 597.5 | 1126.0 |
| Age | 36.34 | 34.35 | 42.07 | 42.73 | 41.85 | 41.64 |
| Work Age Share | 59.9% | 67.8% | 68.2% | 74.8% | 69.8% | 71.2% |
-
Source: Author calculations.
-
*
Median Equivalised Household Disposable Income
Table 6
Income quintile movers by geographical area.
| 1996 Pop. share | 2011 Pop. Share | TOTAL | |||||
|---|---|---|---|---|---|---|---|
| Q1 & Q2 | Q3 | Q4 & Q5 | Q1 & Q2 | Q3 | Q4 & Q5 | ||
| Rural | 63.0% | 20.7% | 16.4% | 70.3% | 19.1% | 10.6% | 100.0% |
| Village (200 – 1499- | 51.2% | 24.4% | 24.4% | 61.1% | 25.4% | 13.5% | 100.0% |
| Town (1500 – 2999) | 66.7% | 22.1% | 11.2% | 68.7% | 23.3% | 8.0% | 100.0% |
| Town (3000 – 4999) | 42.9% | 32.5% | 24.6% | 50.2% | 40.9% | 8.9% | 100.0% |
| Town (5000 – 9999) | 30.7% | 32.3% | 37.0% | 51.2% | 34.7% | 14.1% | 100.0% |
| Town (1000 +) | 45.4% | 20.8% | 33.8% | 33.8% | 30.0% | 36.2% | 100.0% |
| Waterford * | 38.5% | 18.1% | 43.5% | 34.1% | 30.7% | 35.2% | 100.0% |
| Galway | 37.7% | 14.7% | 47.7% | 40.4% | 51.7% | 7.9% | 100.0% |
| Limerick | 50.4% | 9.0% | 40.5% | 39.5% | 15.5% | 45.0% | 100.0% |
| Cork | 34.1% | 24.2% | 41.8% | 31.9% | 13.8% | 54.3% | 100.0% |
| Dublin County | 13.9% | 16.1% | 70.0% | 3.1% | 5.1% | 91.8% | 100.0% |
| Dublin City | 15.9% | 7.1% | 76.9% | 4.5% | 2.0% | 93.5% | 100.0% |
-
Source: Author Calculations.
Table 7
Industry share.
| A | B | C | D | E | F | G | H | |
|---|---|---|---|---|---|---|---|---|
| 1996 Q1 | 12% | 7% | 1a% | 22% | 5% | 7% | 1a% | 11% |
| 2011 Q1 | 5% | 5% | 13% | 29% | 5% | 11% | 20% | 12% |
| 1996 Q5 | 10% | 6% | 17% | 23% | 5% | 7% | 19% | 12% |
| 2011 Q5 | 4% | 5% | 12% | 31% | 4% | 12% | 21% | 11% |
| Mover | ||||||||
| Up 2Q + | 4% | 5% | 13% | 31% | 5% | 12% | 20% | 11% |
| Down 2Q + | 5% | 5% | 12% | 3O% | 4% | 12% | 20% | 11% |
-
Source: Author Calculations.
-
Industry: A – Agriculture, B – Construction, C – Manufacturing, D – Commerce, E – Transport, F – Public Administration, G – Professional Services, H – Other (CSO, 2006).
Table 8
I2 index disposable income by year.
| Disposable income | 1996 | 2002 | 2006 | 2011 |
| I2 | 1 | 1 | 1 | 1 |
| Between | 0.06 | 0.07 | 0.02 | 0.04 |
| Within | 0.94 | 0.93 | 0.98 | 0.96 |
-
Source: Author Calculations.
Download links
A two-part list of links to download the article, or parts of the article, in various formats.