Public investment in irrigation and training, growth and poverty reduction in Ethiopia
- IESD Research, Ethiopia
- Ethiopian Development Research Institute, Ethiopia
Cite this article
as: L. M Beyene, E. Engida; 2016; Public investment in irrigation and training, growth and poverty reduction in Ethiopia; International Journal of Microsimulation; 9(1); 86-108.
doi: 10.34196/ijm.00129
- Article
- Figures and data
- Jump to
Figures
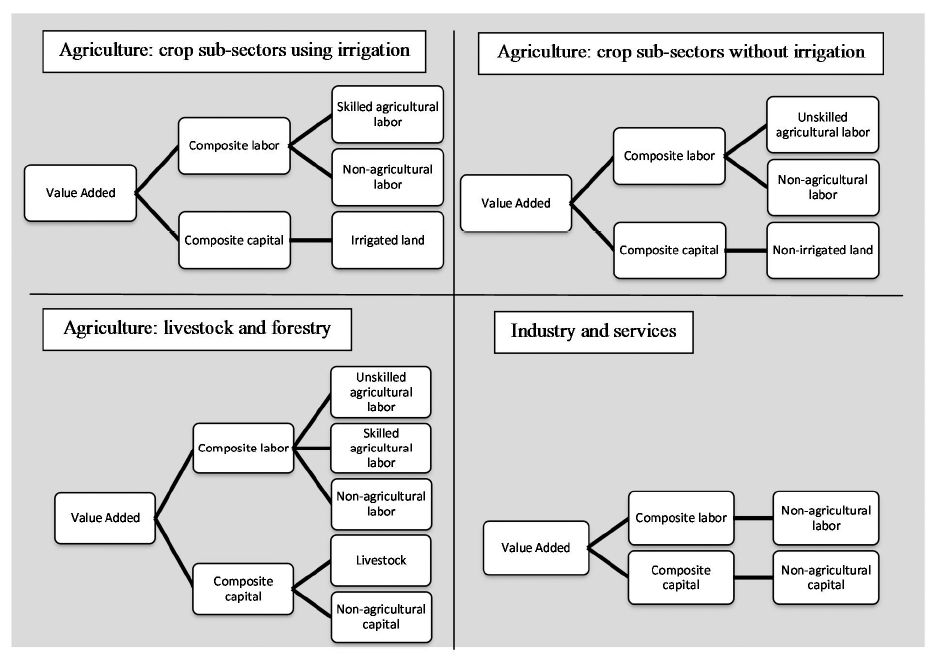
Figure 1

Nested structure of value added.
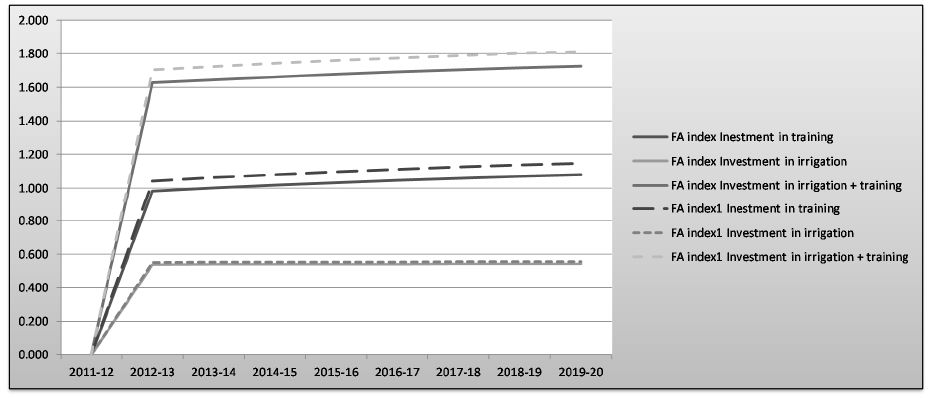
Figure 2

Changes in food availability index: FAindex and FAindex1 (% change from reference scenario).
Tables
Table 1
Summary of scenarios.
| Scenarios | Time frame | |
|---|---|---|
| Simulation 1 | 10% increase in public investment for farmer training | 2nd period |
| 11.8% increase in skilled agricultural labor supply | 3rd period | |
| 1.5% improvement in TFP in irrigated agriculture crop sectors | 3rd period | |
| Simulation 2 | 10% increase in public investment in irrigation uniformly across all agricultural sub-sectors | 2nd period |
| 10.5% increase in irrigated land | 3rd period | |
| 2% improvement in TFP in irrigated agriculture crop sectors | 3rd period | |
| Simulation 3 | Simulation 1 + Simulation 2 for public investment | 2nd period |
| 3.5% improvement in TFP in irrigated agriculture crop sectors | 3rd period |
Table 2
Macroeconomic results (% change from reference scenario).
| Investment in training | Investment in irrigation | Investment in irrigation + training | |||||
|---|---|---|---|---|---|---|---|
| 2014–15 | 2019–20 | 2014–15 | 2019–20 | 2014–15 | 2019–20 | ||
| GDP | Agriculture | 0.16 | 0.16 | 0.21 | 0.21 | 0.41 | 0.41 |
| Irrigated agriculture | 16.63 | 16.62 | 3.91 | 3.90 | 20.91 | 20.89 | |
| Rain-fed agriculture | −2.78 | −2.79 | −0.43 | −0.43 | −3.22 | −3.24 | |
| Manufacturing | −0.17 | −0.48 | −0.03 | −0.06 | −0.21 | −0.55 | |
| Services | 0.03 | 0.03 | −0.01 | −0.03 | 0.02 | 0.00 | |
| TOTAL | 0.07 | 0.04 | 0.09 | 0.07 | 0.17 | 0.13 | |
| Investment | Private | −1.95 | −2.26 | −0.17 | −0.20 | −2.13 | −2.46 |
| Public | 3.69 | 3.69 | 0.32 | 0.32 | 4.01 | 4.01 | |
| TOTAL | −0.03 | −0.07 | 0.01 | 0.00 | −0.02 | −0.06 | |
| Agriculture | −0.37 | −0.44 | −0.28 | −0.29 | −0.71 | −0.79 | |
| Consumer | Agricultural food crops | −0.62 | −0.70 | −0.32 | −0.32 | −0.99 | −1.07 |
| Price | Manufacturing | 0.13 | 0.19 | −0.02 | −0.01 | 0.09 | 0.17 |
| Index | Services | 0.21 | 0.50 | 0.07 | 0.09 | 0.29 | 0.60 |
| TOTAL | −0.08 | −0.03 | −0.12 | −0.11 | −0.23 | −0.17 | |
| Exports | Agriculture | 0.30 | 0.42 | 0.79 | 0.31 | 0.42 | 0.79 |
| Industry | −0.23 | −0.01 | −0.23 | −0.50 | −0.04 | −0.54 | |
| Services | −0.28 | −0.05 | −0.34 | −0.68 | −0.09 | −0.77 | |
| TOTAL | −0.08 | 0.11 | 0.05 | −0.33 | 0.09 | −0.22 | |
| Imports | Agriculture | −0.46 | −0.10 | −0.58 | −0.60 | −0.11 | −0.73 |
| Industry | −0.06 | 0.00 | −0.07 | −0.18 | −0.01 | −0.19 | |
| Services | 0.20 | 0.09 | 0.30 | 0.41 | 0.11 | 0.53 | |
| TOTAL | −0.03 | 0.01 | −0.02 | −0.09 | 0.01 | −0.08 | |
| Output | Agriculture | 0.17 | 0.17 | 0.21 | 0.21 | 0.42 | 0.42 |
| Irrigated agriculture | 16.98 | 16.96 | 3.68 | 3.68 | 21.01 | 20.99 | |
| Rain-fed agriculture | −2.82 | −2.84 | −0.38 | −0.39 | −3.22 | −3.24 | |
| Manufacturing | −0.18 | −0.48 | −0.03 | −0.06 | −0.21 | −0.55 | |
| Services | 0.02 | 0.02 | −0.01 | −0.03 | 0.01 | −0.01 | |
| TOTAL | 0.03 | −0.03 | 0.07 | 0.05 | 0.11 | 0.03 | |
Table 3
Changes in agricultural factors income in real terms ((% change from reference scenario).
| Investment in training | Investment in irrigation | Investment in irrigation + training | ||||
|---|---|---|---|---|---|---|
| 2014–15 | 2019–20 | 2014–15 | 2019–20 | 2014–15 | 2019–20 | |
| Skilled agricultural labor | 11.78 | 11.59 | −8.67 | −8.51 | 11.72 | 11.53 |
| Unskilled agricultural labor | −2.00 | −2.16 | 1.60 | 1.75 | −2.03 | −2.19 |
| Total agricultural labor | 0.38 | 0.22 | −0.38 | −0.22 | 0.39 | 0.23 |
| Irrigated land | 8.80 | 8.58 | 1.11 | 1.06 | 8.28 | 8.06 |
| Non-irrigated land | −3.49 | −3.68 | 2.78 | 2.98 | −3.57 | −3.76 |
| Livestock | 0.00 | −0.06 | 0.12 | 0.17 | 0.03 | −0.02 |
| Total agricultural capital | −1.51 | −1.65 | 1.67 | 1.79 | −1.50 | −1.64 |
| Total agricultural factors | −0.05 | −0.23 | 0.08 | 0.25 | −0.04 | −0.22 |
Table 4
Changes in FGT indices (% change from reference scenario).
| 2014–15 | 2019–20 | |||||
|---|---|---|---|---|---|---|
| Investment in training | Investment in irrigation | Investment in irrigation + training | Investment in training | Investment in irrigation | Investment in irrigation + training | |
| Poverty incidence | ||||||
| National | −0.47 | −0.06 | −0.75 | −0.20 | −0.06 | −0.46 |
| Rural | −0.51 | −0.05 | −0.82 | −0.22 | 0.00 | −0.46 |
| Urban | −0.20 | −0.14 | −0.38 | −0.07 | −0.41 | −0.43 |
| Poverty gap | ||||||
| National | −0.58 | −0.15 | −0.78 | −0.27 | −0.14 | −0.46 |
| Rural | −0.63 | −0.10 | −0.77 | −0.30 | −0.08 | −0.43 |
| Urban | −0.28 | −0.44 | −0.82 | −0.04 | −0.51 | −0.65 |
| Poverty severity | ||||||
| National | −0.63 | −0.16 | −0.84 | −0.28 | −0.14 | −0.48 |
| Rural | −0.68 | −0.10 | −0.82 | −0.32 | −0.08 | −0.44 |
| Urban | −0.34 | −0.52 | −0.96 | −0.05 | −0.56 | −0.72 |
Table 5
Changes in poverty incidence: national rural and urban (cumulative % change from reference scenario in 2010–11).
| 2014–15 | 2019–20 | |||||
|---|---|---|---|---|---|---|
| Investment in training | Investment in irrigation | Investment in irrigation + training | Investment in training | Investment in irrigation | Investment in irrigation + training | |
| National | −1.50 | −0.21 | −2.42 | −0.24 | −0.07 | −0.55 |
| Rural | −1.50 | −0.21 | −2.42 | −0.24 | −0.07 | −0.55 |
| Urban | −0.67 | −0.46 | −1.25 | −0.08 | −0.50 | −0.52 |
Table 6
Changes in the number of poor (cumulative % change from reference scenario in 2010–11).
| BAU reference scenario | Investment in training | Investment in irrigation | Investment in irrigation + training | |
|---|---|---|---|---|
| Total number of poor 2014/15 | −3,477,899.67 | −3,566,496 | −3,490,060 | −3,620,623 |
| Total number of poor 2019/20 | −7,058,304.39 | −7,089,129 | −7,067,681 | −7,128,995 |
| Total number of poor since policy implementation | −654,067 | −185,948 | −900,702 |
Download links
A two-part list of links to download the article, or parts of the article, in various formats.