Export taxes, world prices, and poverty in Argentina: A dynamic CGE-microsimulation analysis
- CEDLAS-FCE-Universidad Nacional, Argentina
- FCE-Universidad Nacional, Argentina
- World Bank, USA
- Article
- Figures and data
- Jump to
Figures

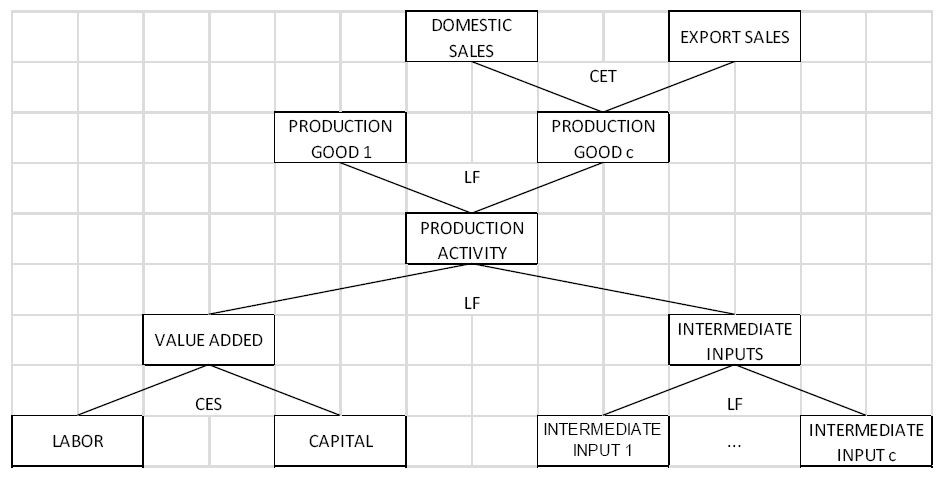
The production side.

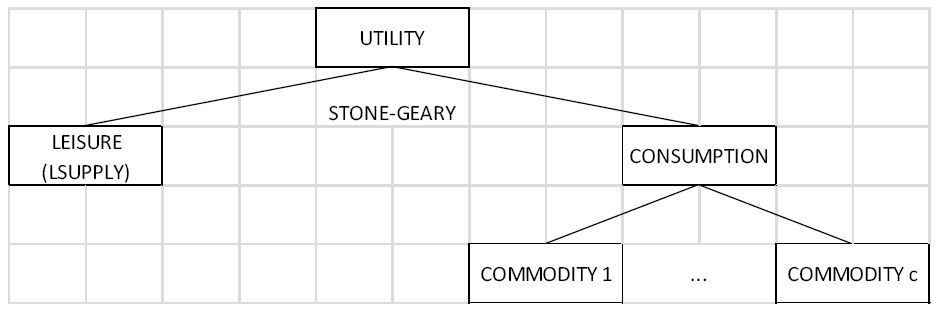
The consumption side.
Tables
Argentina MACROSAM 2005 (percent GDP share).
| Act | Com | Fac | hhd | Gov | Row | s-i | tax | TOTAL | |
|---|---|---|---|---|---|---|---|---|---|
| Act | 196.1 | 196.1 | |||||||
| Com | 111.6 | 60.9 | 12.3 | 25.5 | 20.8 | 231.0 | |||
| Fac | 82.8 | 82.8 | |||||||
| hhd | 79.5 | 9.8 | −1.8 | 87.5 | |||||
| gov | −1.0 | 28.0 | 27.0 | ||||||
| row | 19.4 | 19.4 | |||||||
| s-i | 19.1 | 4.9 | −3.2 | 20.8 | |||||
| tax | 1.8 | 15.5 | 3.2 | 7.5 | 28.0 | ||||
| TOTAL | 196.1 | 231.0 | 82.8 | 87.5 | 27.0 | 19.4 | 20.8 | 28.0 |
-
Source: Argentina SAM 2005.
Sectoral factor intensities (percent).
| sector | VA share | Labor unskilled | Labor semi-skilled | Labor skilled | capital | Nat Res | TOTAL |
|---|---|---|---|---|---|---|---|
| Grains | 3.7 | 6.0 | 5.3 | 3.8 | 56.9 | 28.0 | 100.0 |
| Vegetables and fruits | 1.0 | 22.6 | 19.7 | 14.1 | 15.6 | 28.0 | 100.0 |
| Other crops | 0.8 | 26.4 | 22.9 | 16.5 | 6.2 | 28.0 | 100.0 |
| Livestock, milk and wood | 2.8 | 20.7 | 18.0 | 12.9 | 20.3 | 28.0 | 100.0 |
| Other non-agr primary | 0.4 | 29.6 | 25.8 | 18.5 | 26.1 | 0.0 | 100.0 |
| Oil | 4.1 | 4.6 | 5.0 | 6.1 | 42.2 | 42.2 | 100.0 |
| Mining | 0.7 | 10.3 | 11.4 | 13.8 | 64.5 | 0.0 | 100.0 |
| Meat | 0.8 | 29.1 | 20.1 | 7.6 | 43.2 | 0.0 | 100.0 |
| Other proc food | 2.4 | 31.0 | 21.4 | 8.1 | 39.4 | 0.0 | 100.0 |
| Vegetable oils and fats | 0.3 | 30.5 | 21.1 | 8.0 | 40.5 | 0.0 | 100.0 |
| Dairy products | 0.4 | 38.5 | 26.5 | 10.0 | 25.0 | 0.0 | 100.0 |
| Sugar | 0.2 | 26.4 | 18.2 | 6.9 | 48.5 | 0.0 | 100.0 |
| Beverages and tobacco | 1.3 | 25.1 | 22.6 | 8.2 | 44.1 | 0.0 | 100.0 |
| Textiles and apparel | 1.6 | 27.8 | 18.1 | 6.4 | 47.6 | 0.0 | 100.0 |
| Other manufacturing | 3.6 | 24.4 | 23.6 | 8.4 | 43.6 | 0.0 | 100.0 |
| Petroleum refinery | 0.7 | 12.2 | 21.2 | 17.0 | 49.5 | 0.0 | 100.0 |
| Chemical products | 2.9 | 15.4 | 26.8 | 21.5 | 36.3 | 0.0 | 100.0 |
| Mineral products | 0.6 | 31.2 | 20.2 | 14.0 | 34.6 | 0.0 | 100.0 |
| Metal products | 2.5 | 26.6 | 20.7 | 7.7 | 44.9 | 0.0 | 100.0 |
| Machinery and equipment | 1.6 | 21.5 | 28.6 | 14.0 | 35.9 | 0.0 | 100.0 |
| vehicles | 1.4 | 21.4 | 25.7 | 15.3 | 37.6 | 0.0 | 100.0 |
| services | 66.2 | 18.3 | 19.5 | 18.5 | 43.7 | 0.0 | 100.0 |
-
Source: Argentina SAM 2005.
-
Notes: VA = value added; Nat Res = natural resources.
Sectoral structure of trade structure (percent).
| Sector | Exports (%) (i) | Imports (%) (ii) | Exp.intensity (iii) | Imp. Intensity (iv) |
|---|---|---|---|---|
| Primary | ||||
| Cereals | 6.5 | 0.0 | 59.2 | 0.5 |
| Vegetables and fruit | 2.3 | 0.3 | 29.8 | 4.7 |
| Oil seeds | 5.4 | 0.5 | 34.0 | 4.2 |
| Other crops | 0.8 | 0.5 | 9.4 | 4.6 |
| Livestock, milk and wood | 0.5 | 0.1 | 1.8 | 0.2 |
| Other non-agr primary | 0.1 | 0.2 | 8.3 | 9.2 |
| Mining | 3.3 | 3.0 | 28.9 | 23.6 |
| oil | 5.8 | 0.8 | 25.2 | 3.6 |
| Processed food | ||||
| Meat | 3.8 | 0.2 | 18.0 | 1.1 |
| Other proc food | 5.3 | 1.4 | 15.8 | 4.0 |
| Vegetable oils and fats | 16.7 | 0.1 | 87.8 | 4.6 |
| Dairy products | 1.5 | 0.1 | 14.0 | 0.7 |
| Sugar | 0.3 | 0.0 | 19.4 | 0.2 |
| Beverages and tobacco | 1.2 | 0.2 | 7.5 | 1.0 |
| Other manufactures | ||||
| Textiles and apparel | 3.6 | 4.2 | 17.9 | 17.7 |
| Other manufacturing | 5.8 | 9.0 | 13.8 | 17.5 |
| Petroleum refinery | 8.6 | 2.7 | 38.9 | 14.6 |
| Chemical products | 8.9 | 18.9 | 25.7 | 38.3 |
| Mineral products | 0.5 | 0.9 | 6.1 | 9.6 |
| Metal products | 7.0 | 7.0 | 21.0 | 18.3 |
| Machinery and equipment | 4.1 | 33.6 | 18.6 | 61.3 |
| vehicles | 7.9 | 16.3 | 41.3 | 55.1 |
| TOTAL | 100.0 | 100.0 | 11.8 | 10.4 |
-
Notes:
-
Exports% = share of each sector in total exports.
-
Imports% = share of each sector in total imports.
-
EX intensity = share of exports in production.
-
IM intensity = share of imports in consumption.
-
Source: Argentina SAM 2005.
CGE-microsimulations scenarios.
| Name | Description |
|---|---|
| base | Business as usual scenario |
| Policy shockx | |
| Etax-gsav | 20% yearly cut in export tax with government savings as the equilibrating variable |
| Etax-gcon | 20% yearly cut in export tax with government consumption as the equilibrating variable |
| Etax-dtax | 20% yearly cut in export tax with direct tax rate as the equilibrating varialbe |
| External shockx | |
| Wprice-food | 25% decrease in world food prices in 2008 |
| Wprice-oil | 25% decrease in world oil prices in 2008 |
Real macro indicators by simulation (annual growth rate 2007–2015).
| indicator | Base (LCU$) | Base (chg%) | Policy shocks | External shocks | |||
|---|---|---|---|---|---|---|---|
| Etax-gsav | Etax-gcon | Etax-dtax | Wp-food | Wp-oil | |||
| Absorption | 5,033 | 3.9 | 3.7 | 4.0 | 4.0 | 3.2 | 3.7 |
| Household consumption | 3,263 | 3.8 | 3.9 | 4.1 | 3.9 | 3.4 | 3.8 |
| Government consumption | 657 | 4.1 | 4.1 | 2.9 | 4.1 | 4.1 | 4.1 |
| Fixed investment | 1,114 | 3.9 | 3.1 | 4.4 | 4.2 | 2.2 | 3.4 |
| Exports | 1,365 | 3.8 | 4.0 | 4.4 | 4.3 | 3.7 | 3.8 |
| Imports | −1,041 | 3.8 | 4.1 | 4.6 | 4.5 | 2.7 | 3.5 |
| GDP market price | 5,358 | 3.9 | 3.7 | 4.0 | 4.0 | 3.4 | 3.8 |
| GDP factor cost | 4,434 | 3.9 | 3.7 | 4.0 | 4.0 | 3.6 | 3.8 |
| Real exchange rate | 1 | 0.1 | −0.4 | −0.4 | −0.4 | 0.9 | 0.3 |
-
Source: Author’s estimates.
Unemployment rate by labor type in base year and final year by simulation (%).
| 2015 (final year) | |||||||
|---|---|---|---|---|---|---|---|
| Labor category | 2005 | base | Etax-gsav | Etax-gcon | Etax-dtax | Wp-food | Wp-oil |
| Urban | |||||||
| – Unskilled labor | 19.1 | 13.8 | 14.2 | 13.9 | 14.0 | 14.2 | 13.8 |
| – Semi-skilled labor | 14.6 | 10.6 | 11.0 | 10.7 | 10.8 | 11.0 | 10.6 |
| – Skilled labor | 5.5 | 2.8 | 3.2 | 2.9 | 3.0 | 3.2 | 2.8 |
| – Total | 15.7 | 10.9 | 11.3 | 11.0 | 11.1 | 11.3 | 10.9 |
| Rural | |||||||
| – Unskilled labor | 13.1 | 7.4 | 7.5 | 7.0 | 7.2 | 10.1 | 7.4 |
| – Semi-skilled labor | 10.0 | 6.4 | 6.5 | 6.0 | 6.2 | 9.1 | 6.4 |
| – Skilled labor | 3.8 | 2.5 | 2.5 | 2.5 | 2.5 | 5.0 | 2.5 |
| – Total | 10.7 | 6.2 | 6.3 | 5.9 | 6.1 | 8.9 | 6.2 |
| National | |||||||
| – Unskilled labor | 18.5 | 13.2 | 13.6 | 13.3 | 13.3 | 13.9 | 13.2 |
| – Semi-skilled labor | 14.4 | 10.4 | 10.8 | 10.5 | 10.6 | 10.9 | 10.4 |
| – Skilled labor | 5.4 | 2.8 | 3.2 | 2.9 | 2.9 | 3.3 | 2.8 |
| – Total | 15.3 | 10.5 | 10.9 | 10.6 | 10.7 | 11.1 | 10.5 |
-
Source: Author’s estimates.
Fiscal indicators.
| 2015 (final year) | |||||||
|---|---|---|---|---|---|---|---|
| Labor category | 2005 | base | Etax-gsav | Etax-gcon | Etax-dtax | Wp-food | Wp-oil |
| Gov consumption (share GDP) | 12.3 | 12.3 | 12.4 | 11.0 | 12.2 | 12.9 | 12.4 |
| Gov savings (share GDP) | 4.9 | 4.9 | 3.2 | 4.9 | 4.9 | 3.5 | 4.3 |
| Tax revenue(share GDP) | 28.0 | 28.0 | 26.6 | 26.7 | 27.9 | 27.8 | 27.8 |
| – Export tax | 2.3 | 2.1 | 0.4 | 0.4 | 0.4 | 1.7 | 2.0 |
| – Tariffs | 0.7 | 0.8 | 0.7 | 0.8 | 0.8 | 0.8 | 0.8 |
| – Value added tax | 6.9 | 6.9 | 6.9 | 6.9 | 6.9 | 6.9 | 6.8 |
| – Other indirect taxes | 7.3 | 7.4 | 7.6 | 7.6 | 7.6 | 7.5 | 7.2 |
| – Direct taxes | 10.8 | 10.9 | 11.0 | 11.0 | 12.2 | 10.9 | 10.9 |
-
Source: Author’s estimates.
Sectoral results by simulation (annual growth rate 2007–2015).
| Indicator | Base (LCU$) | Base (chg %) | Policy shocks | External shocks | |||
|---|---|---|---|---|---|---|---|
| Etax-gsav | Etax-gcon | Etax-dtax | Wp-food | Wp-oil | |||
| GDP primary | 596 | 2.9 | 3.1 | 3.3 | 3.3 | 1.9 | 2.6 |
| GDP non-primary | 3,837 | 4.1 | 3.8 | 4.1 | 4.1 | 3.8 | 4.0 |
| Exports primary | 320 | 2.1 | 4.5 | 4.7 | 4.8 | 1.2 | 2.1 |
| Imports primary | 47 | 4.3 | 6.2 | 6.6 | 6.5 | 3.4 | 3.9 |
| Exports non-primary | 1,045 | 4.2 | 3.9 | 4.3 | 4.2 | 4.3 | 4.2 |
| Imports non-primary | 994 | 3.7 | 4.0 | 4.5 | 4.4 | 2.6 | 3.5 |
-
Source: Author’s estimates.
Microsimulation results – changes in poverty (*) Official moderate poverty rate (change in percentage points).
| Policy shocks | External shocks | ||||
|---|---|---|---|---|---|
| Microsimulation effect | Etax-gsav | Etax-gcon | Etax-dtax | Wp-food | Wp-oil |
| Pop | 0.05 | 0.00 | 0.01 | 0.06 | 0.00 |
| Pop + act | −0.05 | 0.00 | −0.02 | −0.03 | 0.01 |
| Pop+ act + uerat | 0.03 | 0.06 | −0.01 | 0.06 | 0.01 |
| Pop + act + uerat + sec | −0.01 | −0.03 | 0.07 | −0.04 | 0.00 |
| Pop + act + uerat + sec + w1 | 0.04 | −0.05 | 0.00 | 0.05 | −0.08 |
| Pop + act + uerat + sec + w1 + w2 | 0.59 | 0.10 | 0.20 | 0.68 | 0.08 |
| Pop + act + uerat + sec + w1 + w2 + cap | 0.00 | −0.02 | −0.01 | 0.04 | 0.00 |
| Pop + act + uerat + sec + w1 + w2 + cap + pl | 1.16 | 1.62 | 1.42 | −3.91 | 0.20 |
| TOTAL | 1.81 | 1.68 | 1.66 | −3.09 | 0.23 |
-
Source: Author’s estimates.
-
(*)
other poverty indicators are available from the authors upon request.
-
Notes: pop = population; act = participation rate; uerat = unemployment rate; sec = sector structure employment; w1 = relative wages; w2 = average wage; cap = non-labor incomes; pl=poverty line.
Export tax rates and tariffs rates (%).
| Export tax | Tariffs | |
|---|---|---|
| Sector | (i) | (ii) |
| Primary | ||
| Cereals | 14.5 | 2.4 |
| Vegetables and fruits | 7.3 | 3.6 |
| Oil seeds | 20.0 | 2.3 |
| Other crops | 7.3 | 2.8 |
| Livestock, milk and wool | 10.9 | 1.9 |
| Other non agr primary | 3.6 | 1.5 |
| Mining | 3.6 | 0.4 |
| oil | 32.7 | |
| Processed food | ||
| Meat | 10.9 | 4.0 |
| Other proc food | 3.6 | 4.8 |
| Vegetable oils and fats | 17.4 | 3.8 |
| Dairy products | 3.6 | 5.6 |
| Sugar | 3.6 | 6.7 |
| Beverages and tobacco | 3.6 | 7.0 |
| Other manufactures | ||
| Textiles and apparel | 3.6 | 6.4 |
| Other manufacturing | 3.6 | 5.2 |
| Petroleum refinery | 3.6 | 0.1 |
| Chemical products | 3.6 | 2.8 |
| Mineral products | 3.6 | 4.2 |
| Metal products | 3.6 | 4.2 |
| Machinery and equipment | 3.6 | 4.7 |
| vehicules | 3.6 | 9.0 |
-
Source: Argentina SAM 2005.
Real macro indicators by simulation and year (growth rate).
| Indicator | Scenario | 2005 | 2006 | 2007 | 2008 | 2009 | 2010 | 2011 | 2012 | 2013 | 2014 | 2015 |
|---|---|---|---|---|---|---|---|---|---|---|---|---|
| Absorption | base | 5,033 | 8.0 | 7.9 | 6.5 | 4.0 | 3.5 | 3.5 | 3.5 | 3.5 | 3.5 | 3.4 |
| Household consumption | base | 3,263 | 8.0 | 8.0 | 6.4 | 3.9 | 3.4 | 3.4 | 3.4 | 3.4 | 3.4 | 3.4 |
| Government consumption | base | 657 | 8.1 | 7.9 | 6.9 | 4.2 | 3.7 | 3.7 | 3.6 | 3.6 | 3.6 | 3.6 |
| Fixed investment | base | 1,114 | 7.9 | 7.8 | 6.6 | 4.0 | 3.5 | 3.5 | 3.5 | 3.5 | 3.5 | 3.5 |
| Exports | base | 1,365 | 7.8 | 7.7 | 6.5 | 3.8 | 3.3 | 3.3 | 3.3 | 3.3 | 3.3 | 3.3 |
| Imports | base | −1,041 | 7.8 | 7.7 | 6.5 | 3.8 | 3.3 | 3.3 | 3.3 | 3.3 | 3.3 | 3.3 |
| GDP market price | base | 5,358 | 8.0 | 7.9 | 6.5 | 4.0 | 3.5 | 3.5 | 3.5 | 3.4 | 3.4 | 3.4 |
| GDP factor cost | base | 4,434 | 8.0 | 8.0 | 6.5 | 4.0 | 3.5 | 3.5 | 3.5 | 3.5 | 3.5 | 3.5 |
| Real exchange rate | base | 1 | 0.2 | 0.5 | −0.3 | 0.1 | 0.1 | 0.2 | 0.2 | 0.2 | 0.2 | 0.1 |
| Absorption | etax-gsav | 5,033 | 8.0 | 7.9 | 6.6 | 3.9 | 3.4 | 3.3 | 3.2 | 3.2 | 3.2 | 3.2 |
| Household consumption | etax-gsav | 3,263 | 8.0 | 8.0 | 6.8 | 4.2 | 3.6 | 3.5 | 3.4 | 3.3 | 3.3 | 3.2 |
| Government consumption | etax-gsav | 657 | 8.1 | 7.9 | 6.9 | 4.2 | 3.7 | 3.7 | 3.6 | 3.6 | 3.6 | 3.6 |
| Fixed investment | etax-gsav | 1,114 | 7.9 | 7.8 | 5.8 | 3.1 | 2.6 | 2.6 | 2.6 | 2.6 | 2.6 | 2.7 |
| Exports | etax-gsav | 1,365 | 7.8 | 7.7 | 7.2 | 4.3 | 3.7 | 3.6 | 3.5 | 3.4 | 3.3 | 3.3 |
| Imports | etax-gsav | −1,041 | 7.8 | 7.7 | 7.4 | 4.5 | 3.8 | 3.7 | 3.5 | 3.4 | 3.3 | 3.3 |
| GDP market price | etax-gsav | 5,358 | 8.0 | 7.9 | 6.6 | 3.9 | 3.4 | 3.3 | 3.3 | 3.2 | 3.2 | 3.2 |
| GDP factor cost | etax-gsav | 4,434 | 8.0 | 8.0 | 6.4 | 3.9 | 3.3 | 3.3 | 3.3 | 3.2 | 3.2 | 3.2 |
| Real exchange rate | etax-gsav | 1 | 0.2 | 0.5 | −1.1 | −0.6 | −0.5 | −0.4 | −0.3 | −0.3 | −0.2 | −0.2 |
| Absorption | etax-gcon | 5,033 | 8.0 | 7.9 | 6.6 | 4.1 | 3.6 | 3.6 | 3.6 | 3.6 | 3.6 | 3.6 |
| Household consumption | etax-gcon | 3,263 | 8.0 | 8.0 | 6.8 | 4.3 | 3.8 | 3.7 | 3.7 | 3.6 | 3.6 | 3.6 |
| Government consumption | etax-gcon | 657 | 8.1 | 7.9 | 4.4 | 2.1 | 2.0 | 2.3 | 2.7 | 2.9 | 3.1 | 3.3 |
| Fixed investment | etax-gcon | 1,114 | 7.9 | 7.8 | 7.3 | 4.6 | 4.0 | 4.0 | 3.9 | 3.8 | 3.8 | 3.8 |
| Exports | etax-gcon | 1,365 | 7.8 | 7.7 | 7.4 | 4.6 | 4.0 | 4.0 | 3.9 | 3.8 | 3.8 | 3.7 |
| Imports | etax-gcon | −1,041 | 7.8 | 7.7 | 7.6 | 4.8 | 4.2 | 4.1 | 4.0 | 4.0 | 3.9 | 3.8 |
| GDP market price | etax-gcon | 5,358 | 8.0 | 7.9 | 6.6 | 4.1 | 3.6 | 3.6 | 3.6 | 3.6 | 3.6 | 3.6 |
| GDP factor cost | etax-gcon | 4,434 | 8.0 | 8.0 | 6.5 | 4.0 | 3.6 | 3.6 | 3.6 | 3.6 | 3.6 | 3.6 |
| Real exchange rate | etax-gcon | 1 | 0.2 | 0.5 | −1.0 | −0.5 | −0.5 | −0.4 | −0.3 | −0.3 | −0.2 | −0.2 |
| Absorption | etax-dtax | 5,033 | 8.0 | 7.9 | 6.6 | 4.1 | 3.6 | 3.6 | 3.5 | 3.5 | 3.5 | 3.5 |
| Household consumption | etax-dtax | 3,263 | 8.0 | 8.0 | 6.4 | 4.0 | 3.5 | 3.5 | 3.5 | 3.5 | 3.5 | 3.5 |
| Government consumption | etax-dtax | 657 | 8.1 | 7.9 | 6.9 | 4.2 | 3.7 | 3.7 | 3.6 | 3.6 | 3.6 | 3.6 |
| Fixed investment | etax-dtax | 1,114 | 7.9 | 7.8 | 7.0 | 4.3 | 3.8 | 3.7 | 3.7 | 3.7 | 3.7 | 3.6 |
| Exports | etax-dtax | 1,365 | 7.8 | 7.7 | 7.3 | 4.5 | 3.9 | 3.9 | 3.8 | 3.7 | 3.7 | 3.6 |
| Imports | etax-dtax | −1,041 | 7.8 | 7.7 | 7.5 | 4.7 | 4.1 | 4.0 | 3.9 | 3.9 | 3.8 | 3.7 |
| GDP market price | etax-dtax | 5,358 | 8.0 | 7.9 | 6.6 | 4.1 | 3.5 | 3.5 | 3.5 | 3.5 | 3.5 | 3.5 |
| GDP factor cost | etax-dtax | 4,434 | 8.0 | 8.0 | 6.5 | 4.0 | 3.5 | 3.5 | 3.5 | 3.5 | 3.5 | 3.5 |
| Real exchange rate | etax-dtax | 1 | 0.2 | 0.5 | −1.1 | −0.6 | −0.5 | −0.4 | −0.3 | −0.3 | −0.2 | −0.2 |
| Absorption | wp-food | 5,033 | 8.0 | 7.9 | 4.1 | 3.5 | 3.0 | 3.0 | 3.0 | 3.0 | 3.0 | 3.1 |
| Household consumption | wp-food | 3,263 | 8.0 | 8.0 | 5.2 | 3.5 | 3.0 | 3.1 | 3.1 | 3.1 | 3.1 | 3.1 |
| Government consumption | wp-food | 657 | 8.1 | 7.9 | 6.9 | 4.2 | 3.7 | 3.7 | 3.6 | 3.6 | 3.6 | 3.6 |
| Fixed investment | wp-food | 1,114 | 7.9 | 7.8 | −0.6 | 2.9 | 2.4 | 2.5 | 2.5 | 2.5 | 2.5 | 2.6 |
| Exports | wp-food | 1,365 | 7.8 | 7.7 | 10.0 | 3.1 | 2.6 | 2.7 | 2.7 | 2.7 | 2.8 | 2.8 |
| Imports | wp-food | −1,041 | 7.8 | 7.7 | 1.0 | 3.3 | 2.8 | 2.8 | 2.8 | 2.9 | 2.9 | 2.9 |
| GDP market price | wp-food | 5,358 | 8.0 | 7.9 | 6.2 | 3.4 | 2.9 | 3.0 | 3.0 | 3.0 | 3.0 | 3.0 |
| GDP factor cost | wp-food | 4,434 | 8.0 | 8.0 | 6.8 | 3.5 | 3.0 | 3.0 | 3.0 | 3.1 | 3.1 | 3.1 |
| Real exchange rate | wp-food | 1 | 0.2 | 0.5 | 7.3 | 0.1 | 0.1 | 0.1 | 0.1 | 0.1 | 0.1 | 0.1 |
| Absorption | wp-oil | 5,033 | 8.0 | 7.9 | 5.9 | 3.8 | 3.3 | 3.3 | 3.3 | 3.3 | 3.3 | 3.3 |
| Household consumption | wp-oil | 3,263 | 8.0 | 8.0 | 6.4 | 3.8 | 3.3 | 3.3 | 3.3 | 3.3 | 3.3 | 3.3 |
| Government consumption | wp-oil | 657 | 8.1 | 7.9 | 6.9 | 4.2 | 3.7 | 3.7 | 3.6 | 3.6 | 3.6 | 3.6 |
| Fixed investment | wp-oil | 1,114 | 7.9 | 7.8 | 4.1 | 3.7 | 3.2 | 3.2 | 3.2 | 3.2 | 3.2 | 3.3 |
| Exports | wp-oil | 1,365 | 7.8 | 7.7 | 8.0 | 3.6 | 3.1 | 3.1 | 3.1 | 3.1 | 3.1 | 3.1 |
| Imports | wp-oil | −1,041 | 7.8 | 7.7 | 5.2 | 3.7 | 3.2 | 3.2 | 3.2 | 3.2 | 3.2 | 3.2 |
| GDP market price | wp-oil | 5,358 | 8.0 | 7.9 | 6.6 | 3.8 | 3.3 | 3.3 | 3.3 | 3.3 | 3.3 | 3.3 |
| GDP factor cost | wp-oil | 4,434 | 8.0 | 8.0 | 6.6 | 3.8 | 3.3 | 3.3 | 3.4 | 3.4 | 3.4 | 3.4 |
| Real exchange rate | wp-oil | 1 | 0.2 | 0.5 | 1.7 | 0.1 | 0.1 | 0.1 | 0.1 | 0.1 | 0.1 | 0.1 |
-
Source: Author’s estimates.