Data and model cross-validation to improve accuracy of microsimulation results: Estimates for the polish household budget survey
- Centre for Economic Analysis, Poland
- Article
- Figures and data
- Jump to
Figures

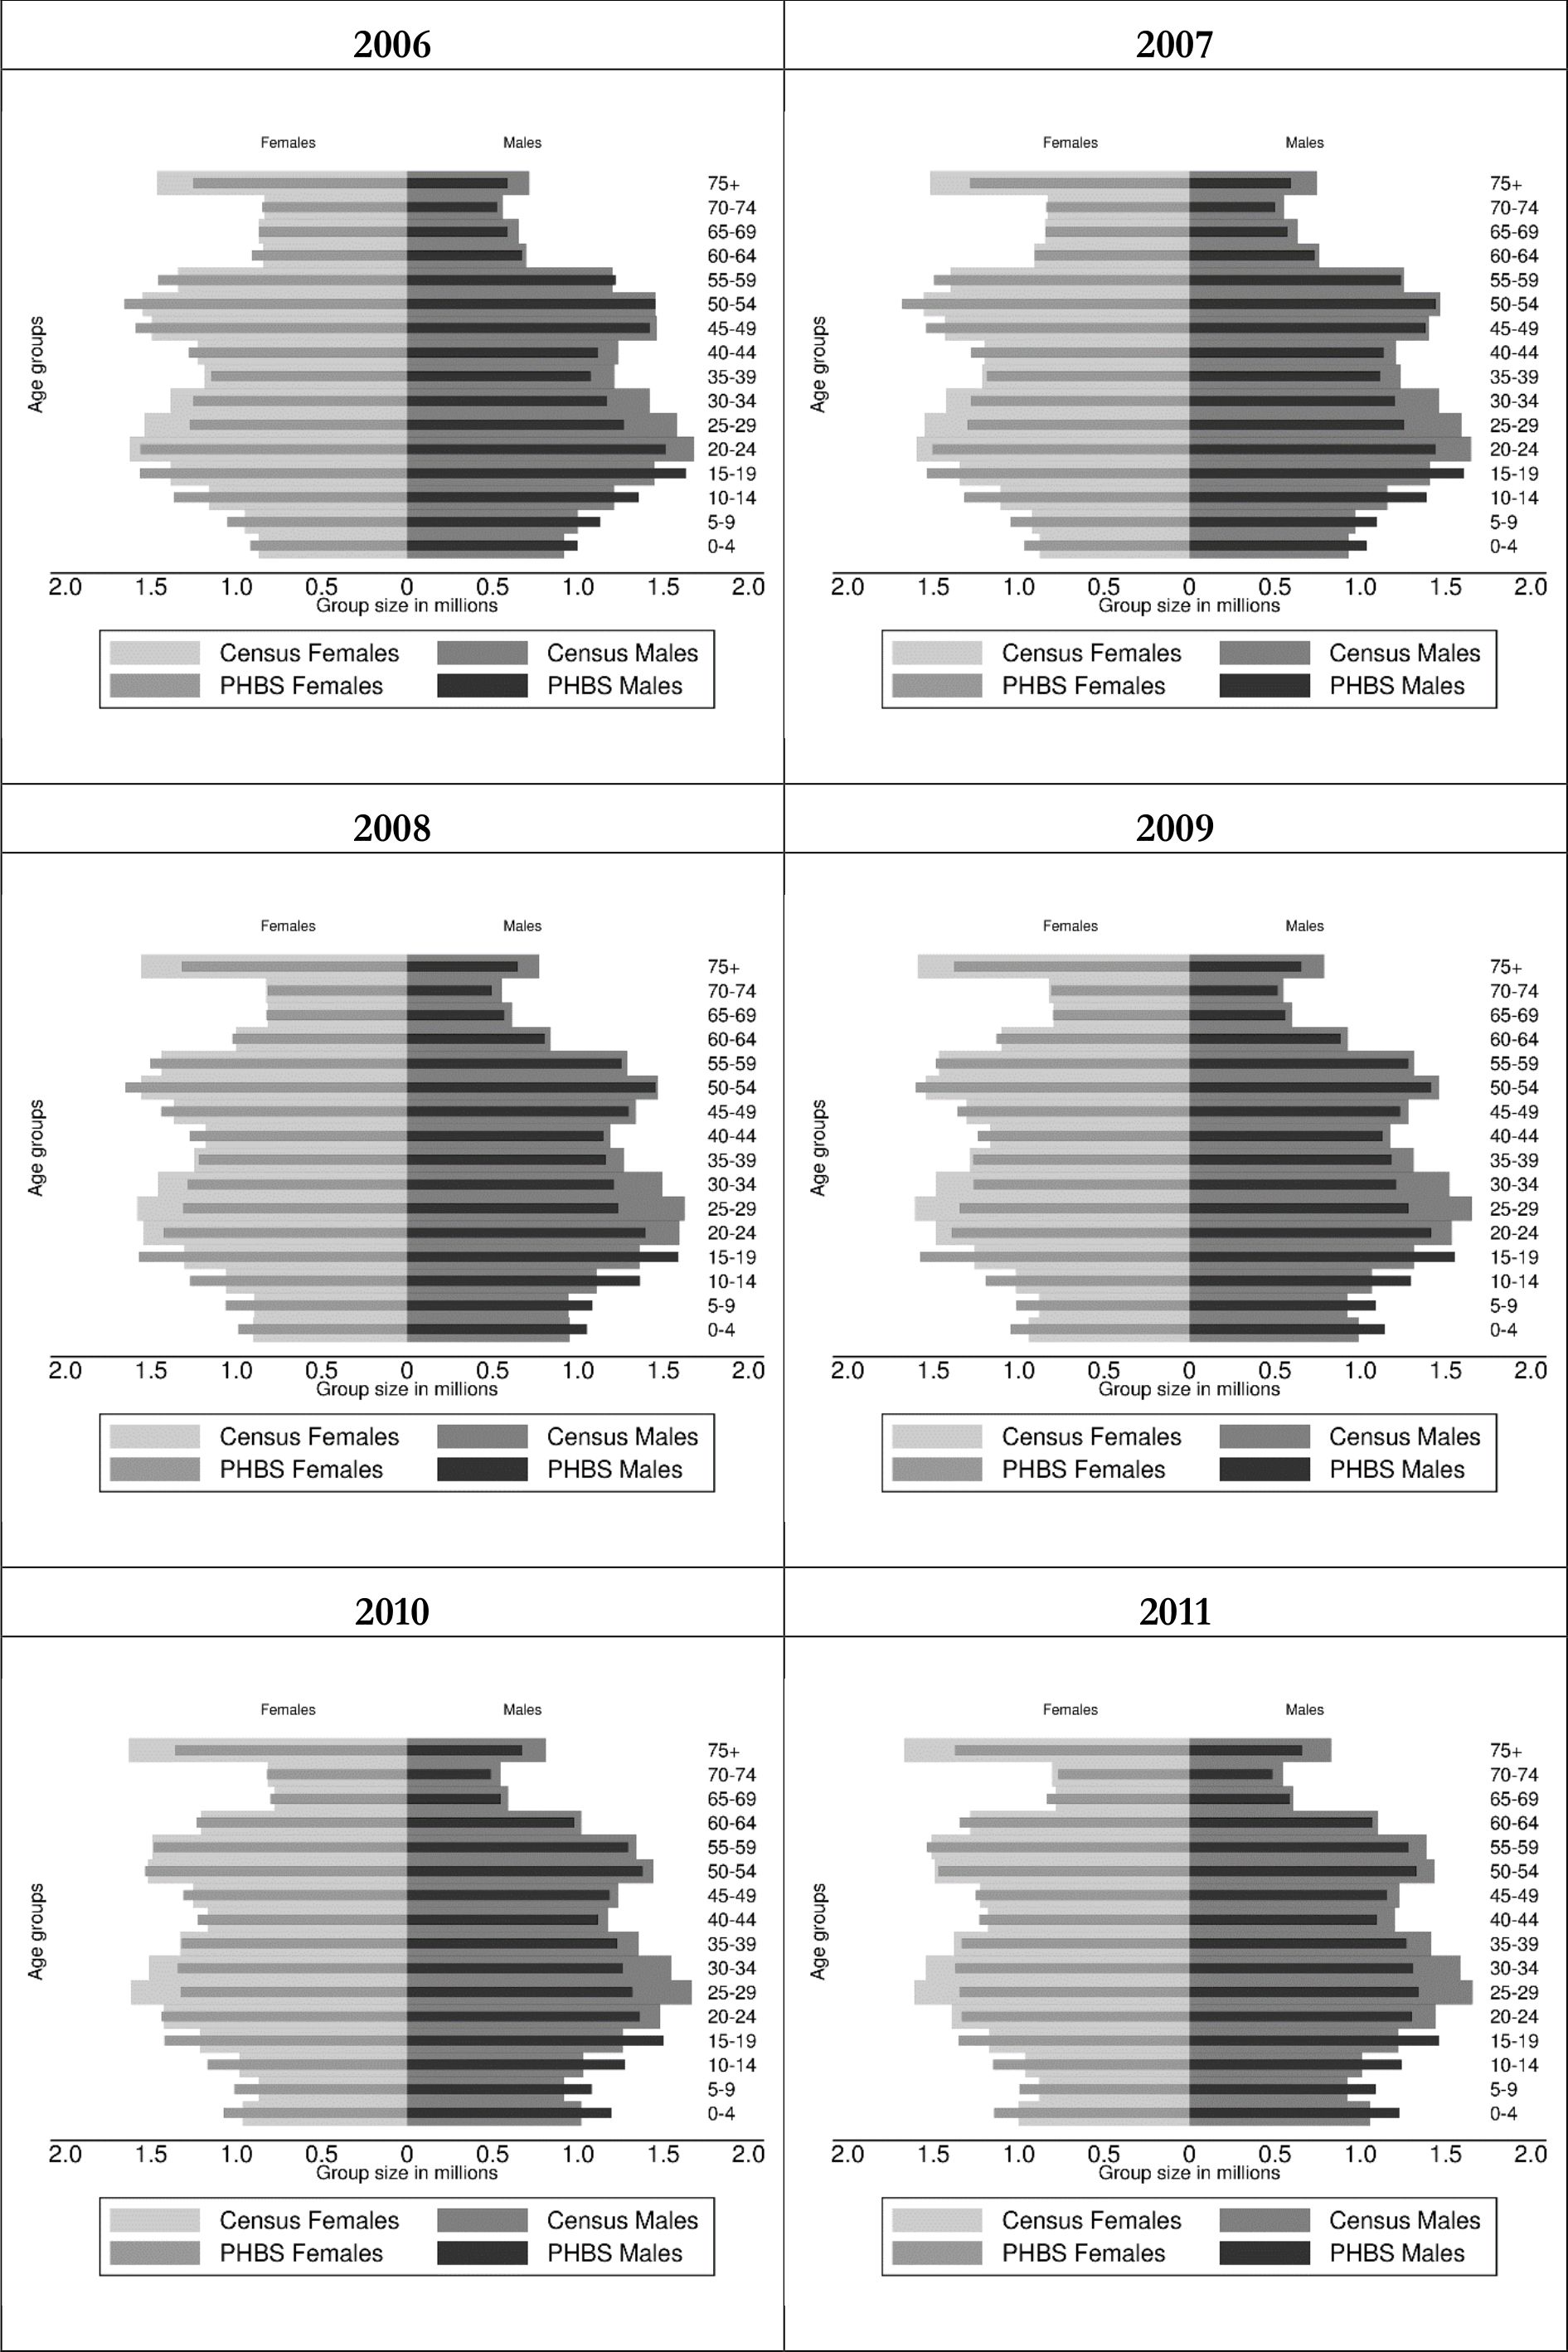
Population age structure in baseline PHBS and demographic CSO statistics: 2006–2011.
Source: Baseline PHBS 2006–2011 and external statistics (see endnote 2 for sources).

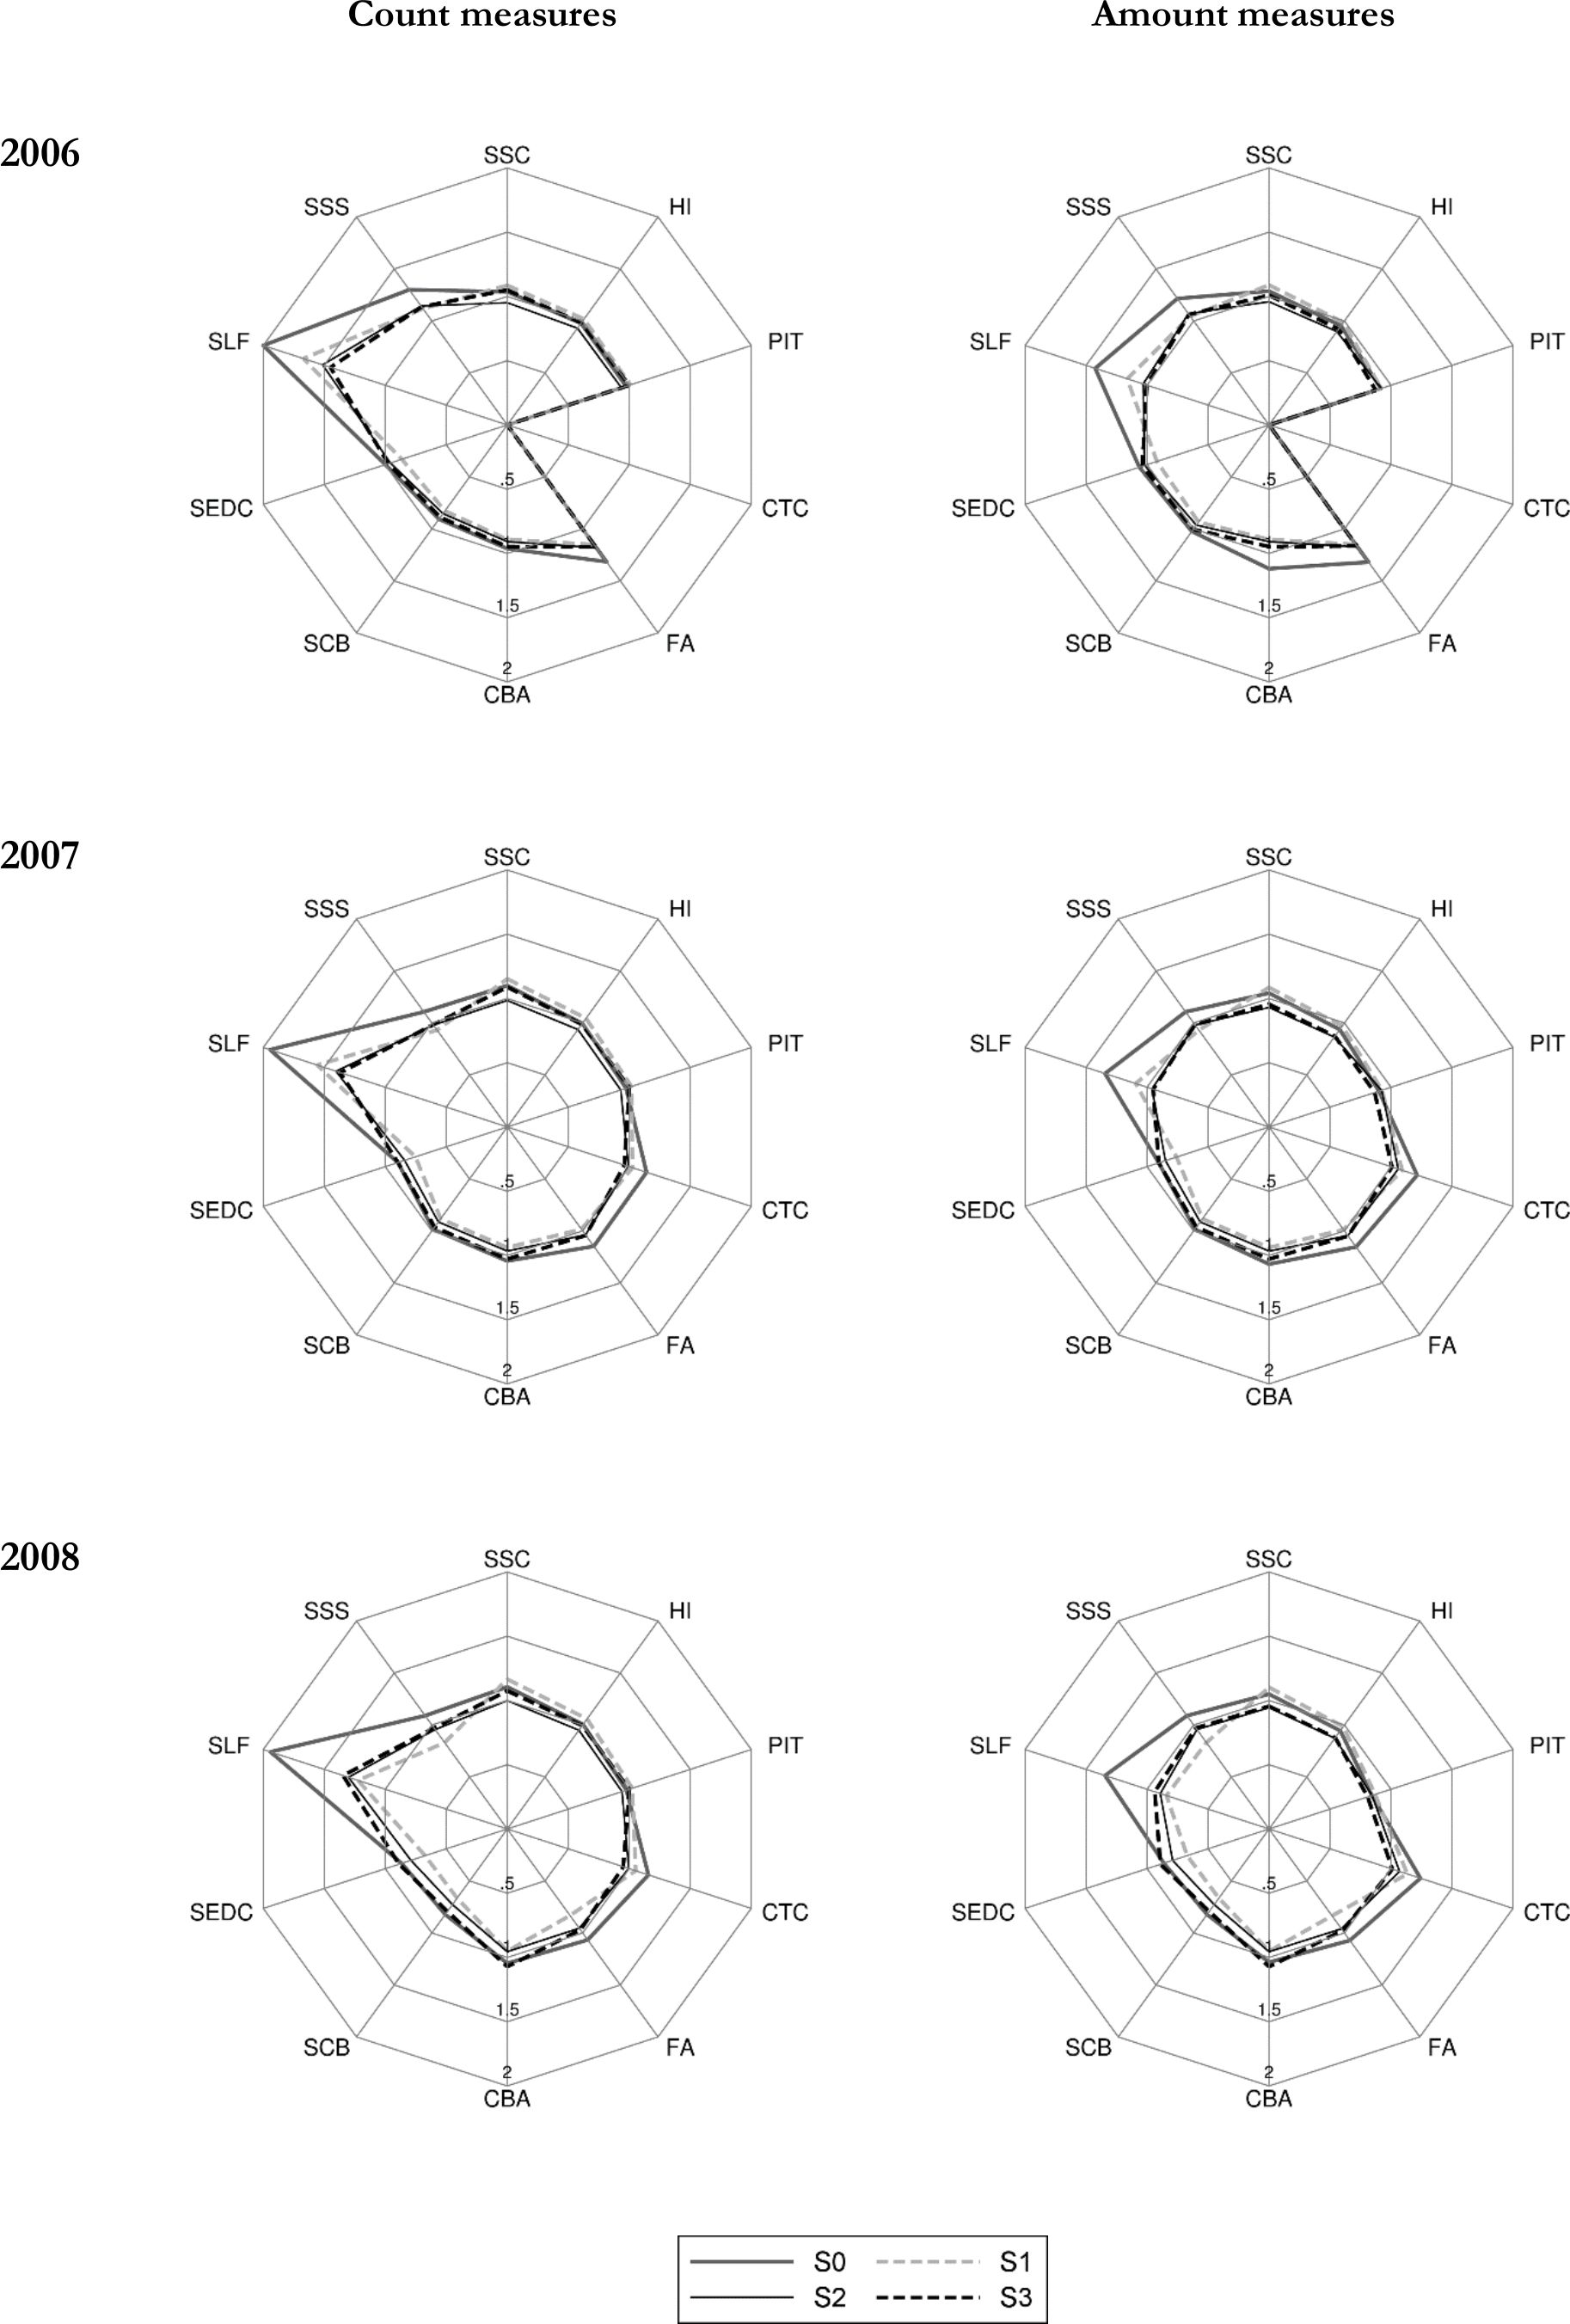
Macrovalidation results: Selected tax and benefit outcomes using different weights (S0, S1, S2, S3): 2006, 2007 and 2008 relative to administrative data.
Source: SIMPL model on PHBS 2009–2011 and external statistics (see endnote 2 for sources).

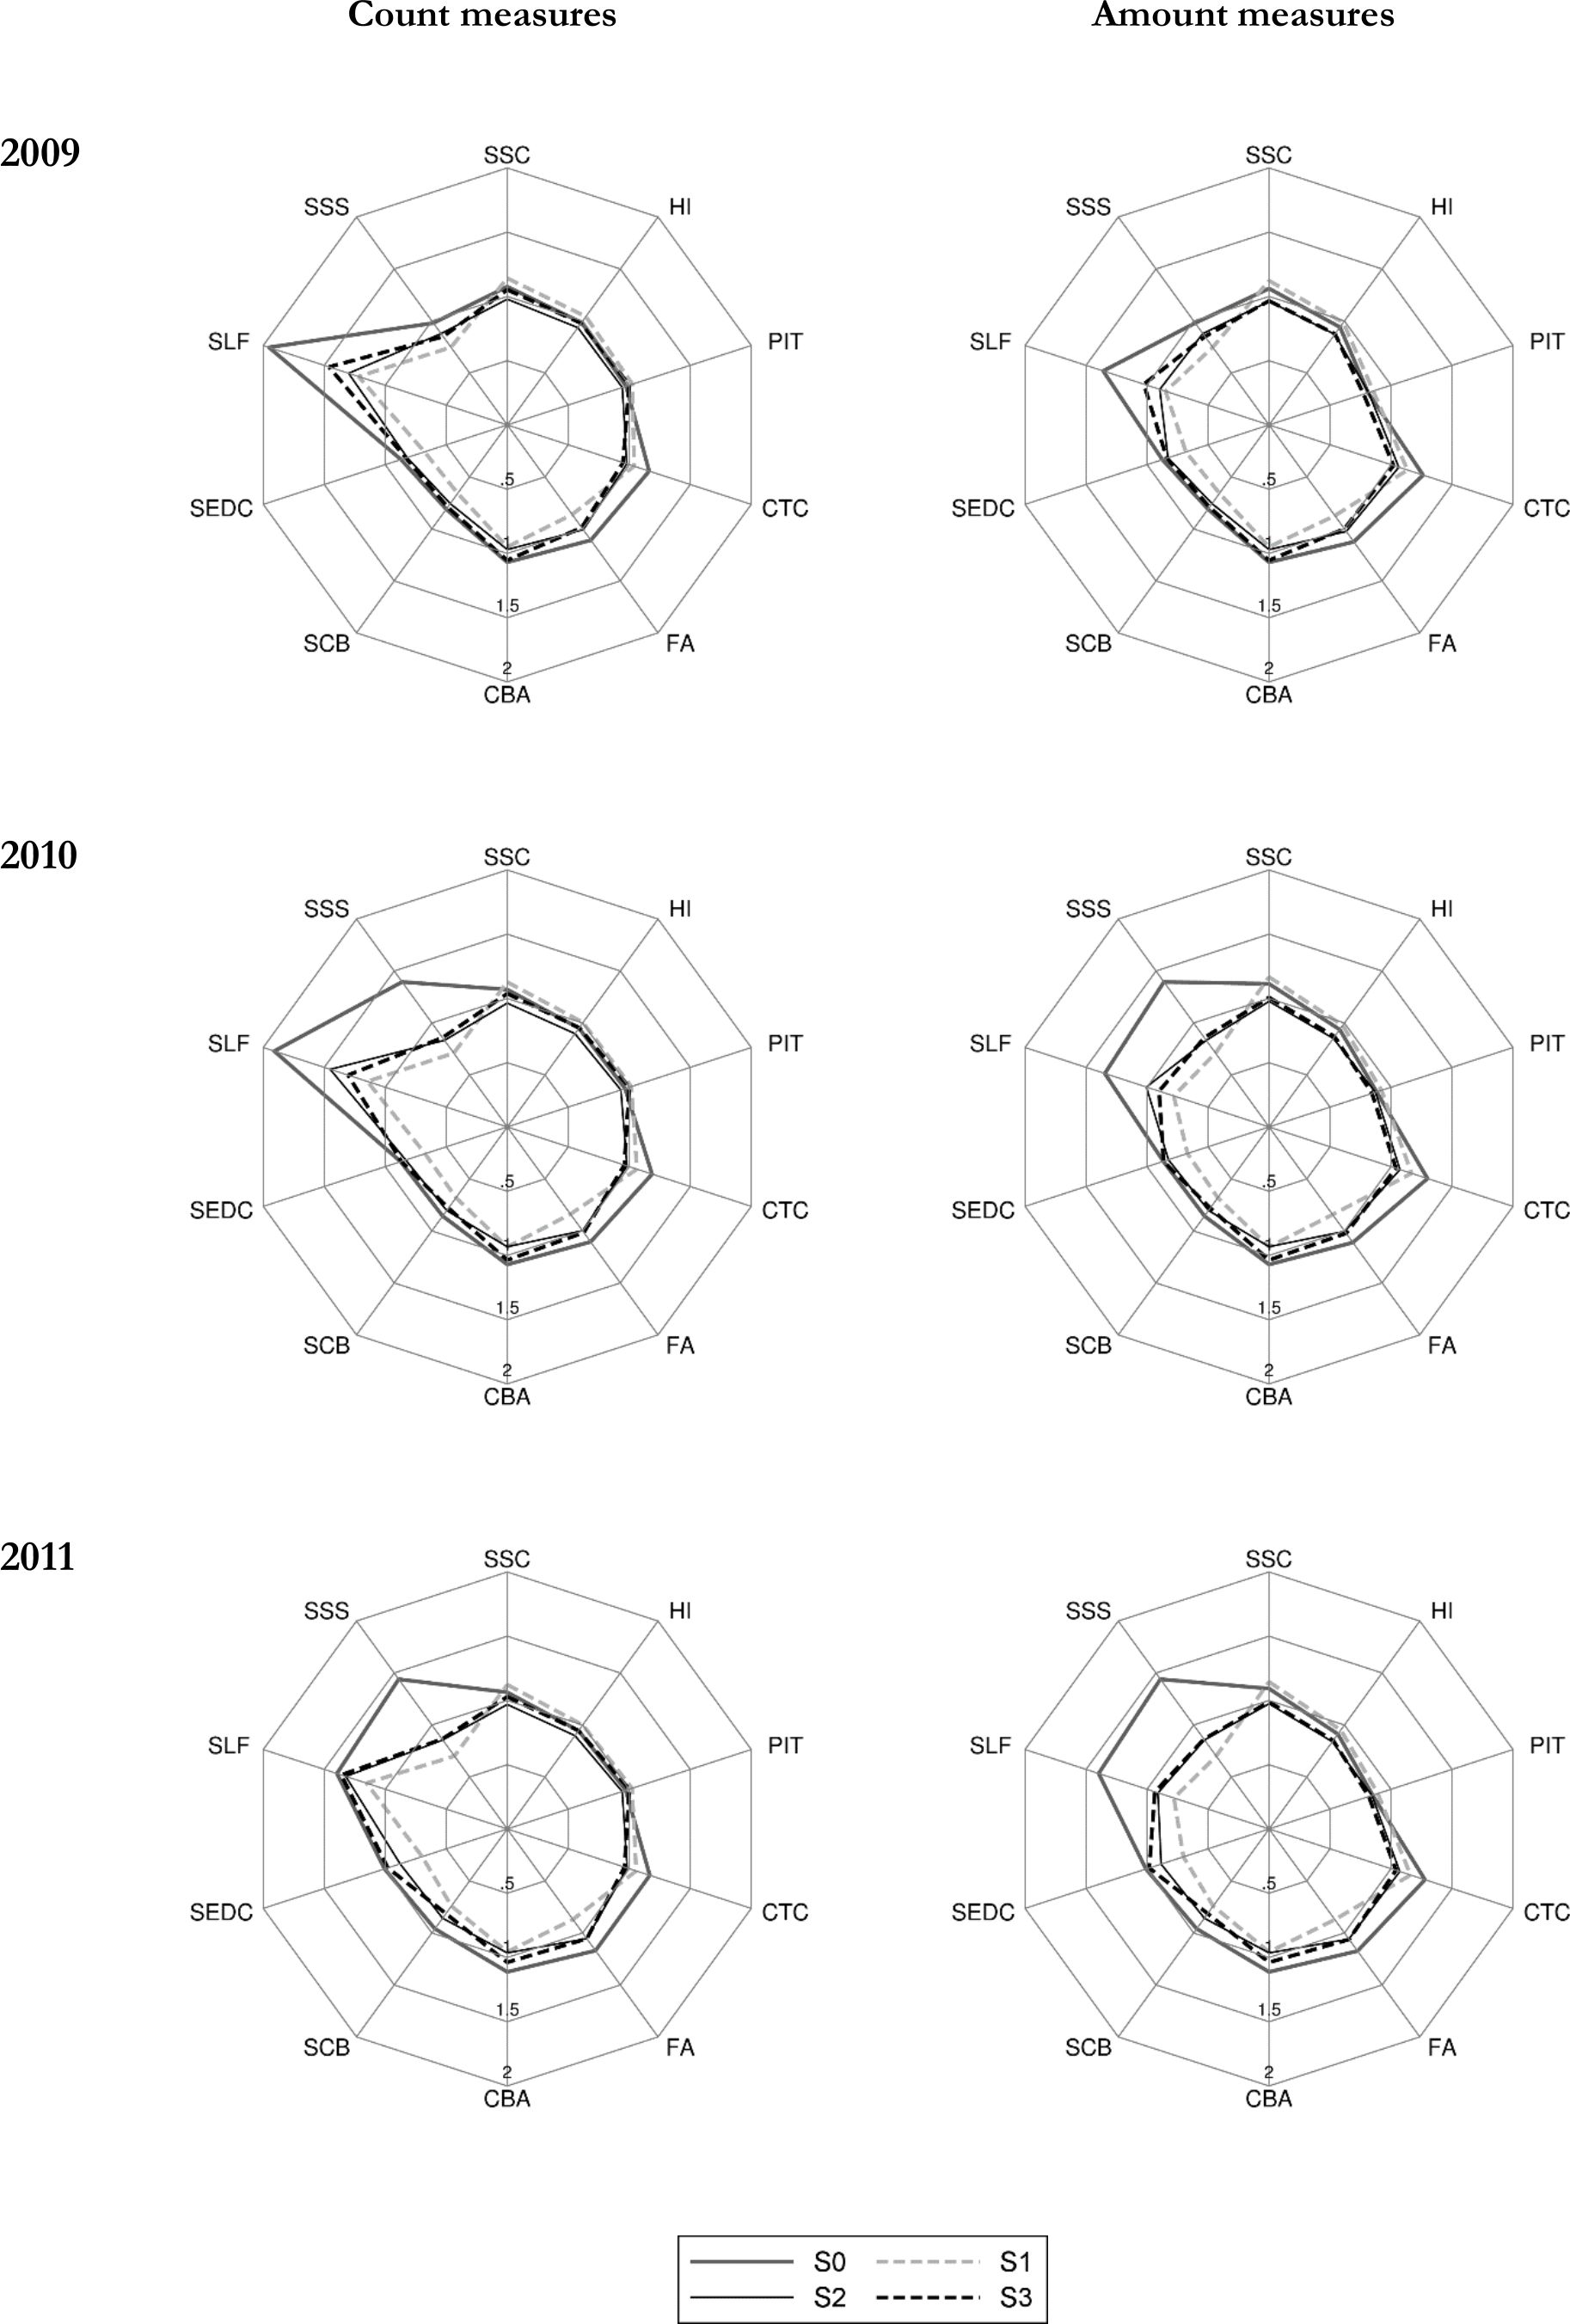
Macrovalidation results: selected tax and benefit outcomes using different weights (S0, S1, S2, S3): 2009, 2010 and 2011 relative to administrative data
Source: SIMPL model on PHBS 2009–2011 and external statistics (see endnote 2 for sources).

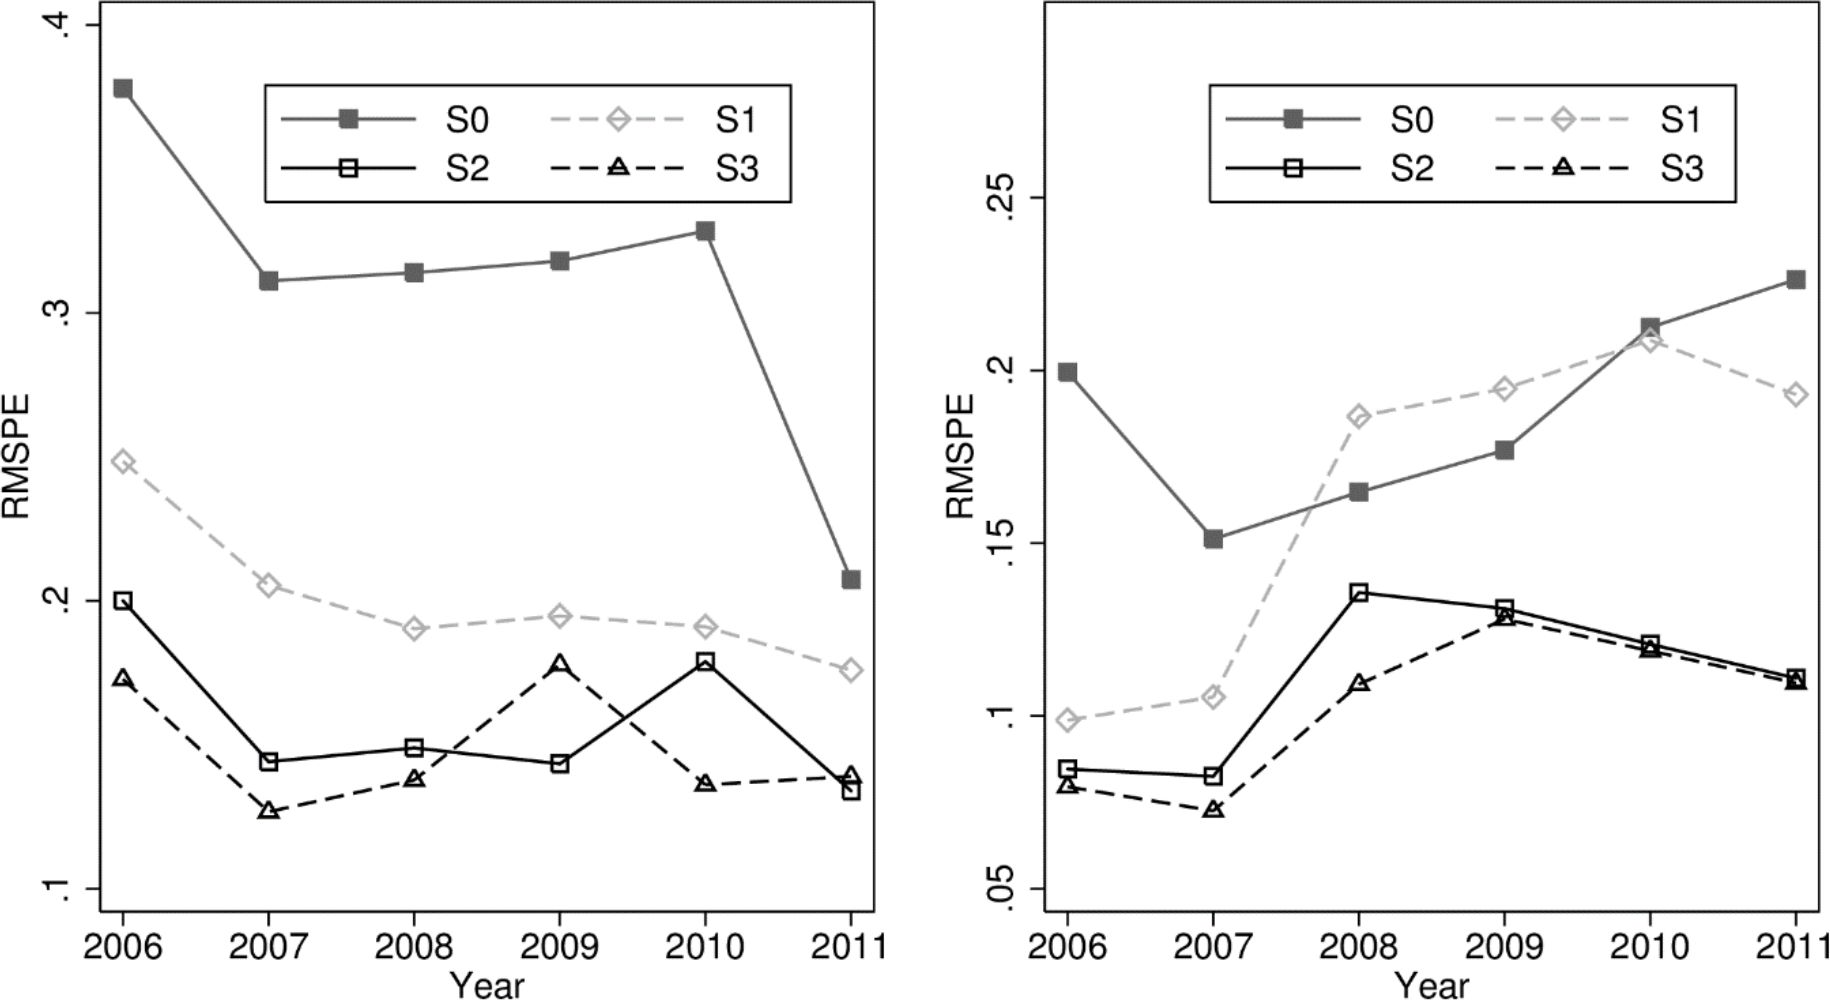
Mean square relative distance measure using different weights (S0, S1, S2, S3).
Source: SIMPL model on PHBS 2006–2011 and external statistics (see endnote 2 for sources).

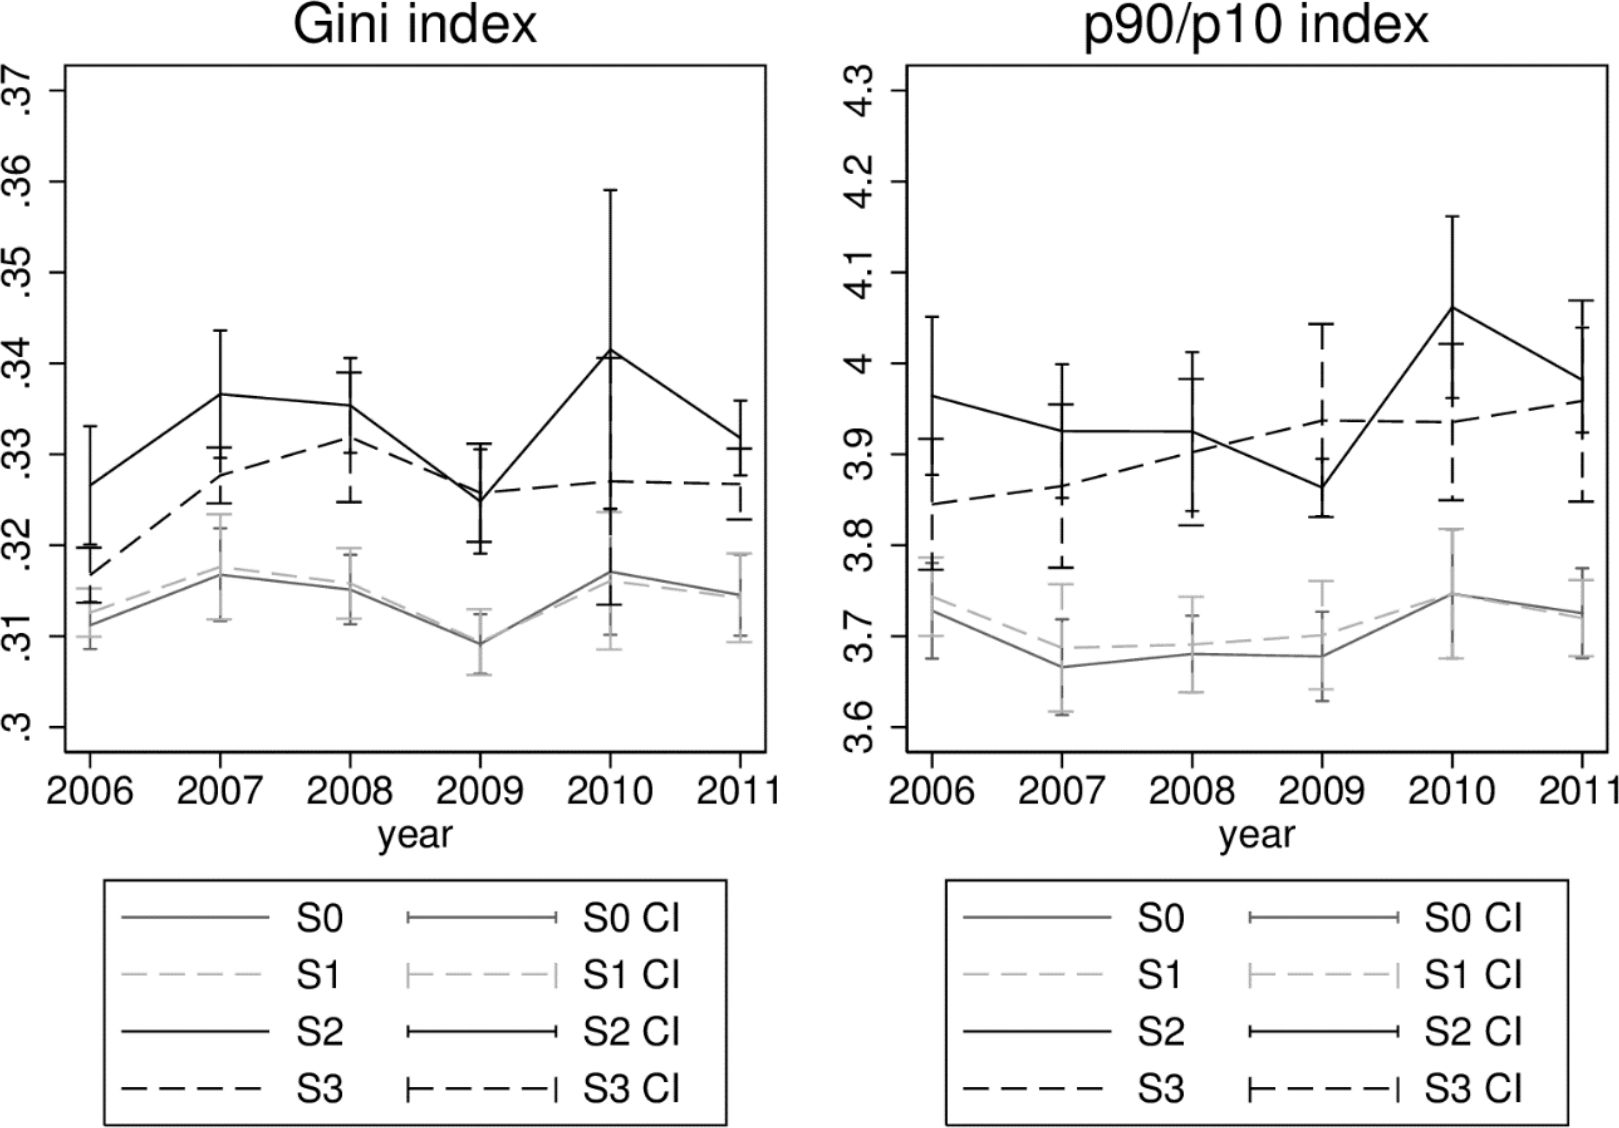
Inequality levels using different weights (S0, S1, S2, S3).
Source: SIMPL model on PHBS 2006–2011.

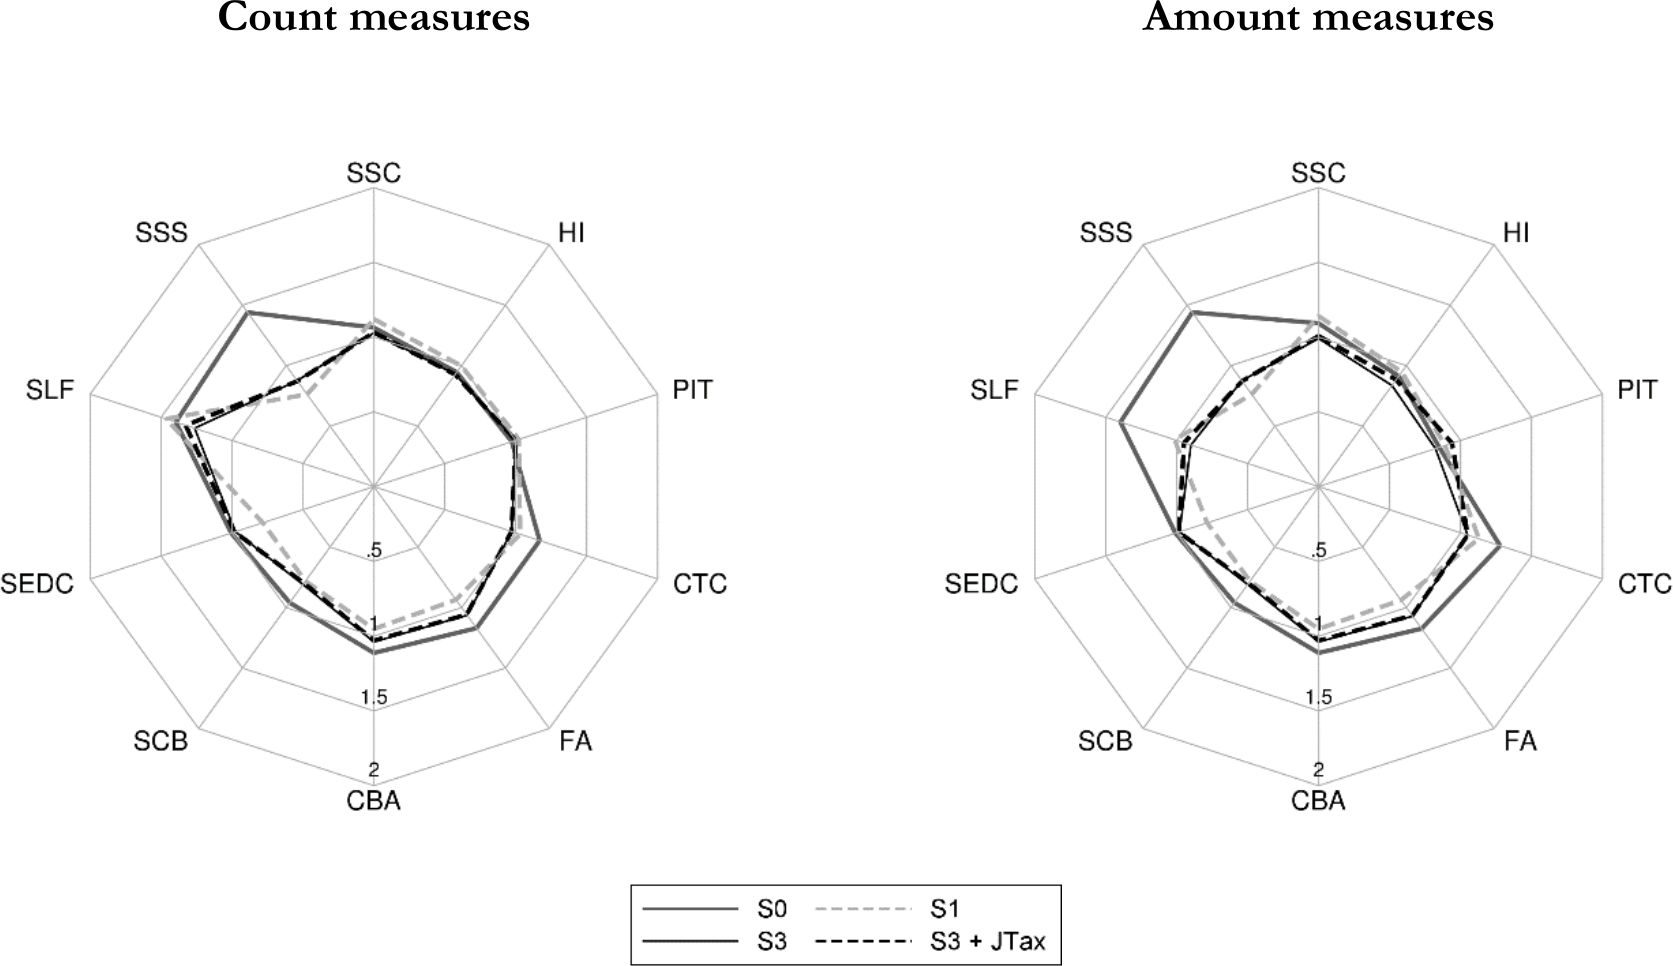
Macrovalidation results: Selected tax and benefit outcomes using different weights (S0, S1, S3, S3+JTax): 2011 relative to administrative data.
Source: SIMPL model on PHBS 2011 and external statistics (see endnote 2 for sources).
Tables
PHBS sample summary for years 2005–2011.
| YEAR | 2006 | 2007 | 2008 | 2009 | 2010 | 2011 |
|---|---|---|---|---|---|---|
| Number of HH | 37,508 | 37,366 | 37,358 | 37,302 | 37,412 | 37,375 |
| Number of individuals | 114,311 | 111,992 | 109,819 | 108,038 | 107,967 | 107,239 |
| Place of residence | ||||||
| Town over 500 k | 11,187 | 11,262 | 10,890 | 10,427 | 10,633 | 10,787 |
| Town over 200 k | 9,097 | 8,721 | 8,670 | 8,704 | 8,471 | 8,284 |
| Town over 100 k | 7,949 | 7,820 | 7,101 | 6,700 | 6,617 | 6,981 |
| Town over 20 k | 19,137 | 18,022 | 17,930 | 17,493 | 16,917 | 17,004 |
| Town up to 20 k | 11,675 | 11,957 | 11,401 | 11,568 | 12,516 | 12,076 |
| village | 55,266 | 54,210 | 53,827 | 53,146 | 52,813 | 52,170 |
| Gender | ||||||
| Adult male | 40,749 | 40,006 | 39,552 | 39,359 | 39,614 | 39,491 |
| Adult female | 46,258 | 45,665 | 45,160 | 44,817 | 44,943 | 44,825 |
| Children (< 18 years old) | 27,304 | 26,321 | 25,107 | 23,862 | 23,410 | 22,923 |
| Labour market status | ||||||
| Is employed | 44,625 | 45,903 | 46,074 | 44,734 | 44,144 | 43,719 |
| Is self-employed | 13,017 | 12,476 | 11,833 | 11,607 | 10,771 | 10,274 |
| Education | ||||||
| higher | 10,311 | 10,832 | 11,488 | 12,267 | 13,778 | 14,529 |
| secondary | 29,980 | 29,882 | 29,518 | 29,279 | 28,347 | 28,182 |
| primary | 56,402 | 54,215 | 52,509 | 50,765 | 50,108 | 48,873 |
| Mean age (sample) | 36.49 | 36.88 | 37.54 | 38.03 | 38.22 | 38.55 |
| Mean HH size (sample) | 3.05 | 3.00 | 2.94 | 2.90 | 2.89 | 2.87 |
-
Source: PHBS data 2006–2011, unweighted sample statistics.
PHBS and external statistics: Socio-demographics for years 2006–2011 using baseline CSO weights.
| 2006 | 2007 | 2008 | 2009 | 2010 | 2011 | |
|---|---|---|---|---|---|---|
| Population | 37.661 | 37.665 | 37.679 | 37.678 | 37.687 | 37.683 |
| External | 38.132 | 38.116 | 38.116 | 38.154 | 38.187 | 38.512 |
| Relative to external: | 0.988 | 0.988 | 0.989 | 0.988 | 0.987 | 0.987 |
| Age (mean) | 37.102 | 37.161 | 37.363 | 37.486 | 37.577 | 37.734 |
| Household size (mean) | 2.828 | 2.828 | 2.829 | 2.829 | 2.830 | 2.829 |
| Residence size (inhabitants): | ||||||
| Towns > 200k | 8.094 | 8.110 | 8.133 | 8.133 | 7.926 | 7.895 |
| Relative to external: | 1.015 | 1.021 | 1.026 | 1.016 | 1.003 | 1.001 |
| Towns < 200k | 3.061 | 3.075 | 2.910 | 2.908 | 2.926 | 3.032 |
| Relative to external: | 1.001 | 1.009 | 0.956 | 0.957 | 0.963 | 1.009 |
| Towns < 100k | 7.467 | 7.202 | 7.377 | 7.304 | 7.044 | 7.187 |
| Relative to external: | 1.008 | 0.975 | 0.996 | 0.988 | 0.951 | 0.956 |
| Towns < 20k | 4.590 | 4.830 | 4.802 | 4.974 | 5.331 | 5.120 |
| Relative to external: | 0.931 | 0.979 | 0.977 | 1.009 | 1.084 | 1.029 |
| Rural | 14.449 | 14.448 | 14.457 | 14.457 | 14.460 | 14.449 |
| Relative to external: | 0.979 | 0.988 | 0.989 | 0.988 | 0.987 | 0.978 |
| Education | ||||||
| Primary | 17.919 | 17.558 | 17.311 | 17.009 | 16.777 | 16.498 |
| Relative to external: | 1.103 | 1.101 | 1.106 | 1.107 | 1.113 | 1.097 |
| Secondary | 10.340 | 10.349 | 10.451 | 10.443 | 10.073 | 9.995 |
| Relative to external: | 0.943 | 0.941 | 0.938 | 0.934 | 0.901 | 0.945 |
| Higher | 3.766 | 3.985 | 4.228 | 4.517 | 5.068 | 5.328 |
| Relative to external: | 0.742 | 0.729 | 0.733 | 0.744 | 0.791 | 0.936 |
-
Source: SIMPL model based on PHBS data 2006–2011 and external statistics (see endnote 2 for sources), weighted with baseline weights. Absolute values in millions.
PHBS and external statistics: Income data for years 2006–2011 using baseline CSO weights.
| 2006 | 2007 | 2008 | 2009 | 2010 | 2011 | |
|---|---|---|---|---|---|---|
| Employment type and farmers: | ||||||
| Employed | 14.492 | 15.216 | 15.606 | 15.369 | 15.224 | 15.141 |
| Relative to external: | 1.126 | 1.154 | 1.138 | 1.116 | 1.101 | 1.096 |
| Self-employed | 3.787 | 3.710 | 3.570 | 3.571 | 3.357 | 3.223 |
| Relative to external: | 0.986 | 0.973 | 0.908 | 0.915 | 0.861 | 0.830 |
| Farmers | 2.415 | 2.277 | 2.140 | 2.067 | 1.818 | 1.715 |
| Relative to external: | 1.314 | 1.239 | 1.164 | 1.125 | 0.989 | 0.914 |
| Temporary employment | 0.682 | 0.594 | 0.564 | 0.521 | 0.463 | 0.412 |
| Relative to external: | 1.921 | 1.621 | 1.491 | 1.299 | 1.041 | 0.810 |
| SSC benefit recipients: | 6.096 | 6.151 | 6.457 | 6.634 | 6.545 | 6.501 |
| Retirement pension | 1.038 | 1.023 | 1.043 | 1.040 | 1.030 | 1.033 |
| Relative to external: | 1.980 | 1.824 | 1.690 | 1.545 | 1.450 | 1.398 |
| Disability pension | 1.048 | 1.021 | 1.009 | 0.986 | 0.967 | 0.972 |
| Relative to external: | 1.198 | 1.149 | 1.060 | 1.047 | 1.039 | 1.023 |
| Family pension | 0.862 | 0.826 | 0.763 | 0.754 | 0.747 | 0.735 |
| Relative to external: | 0.452 | 0.370 | 0.234 | 0.147 | 0.157 | 0.146 |
| Pre-retirement pension | 0.990 | 1.005 | 0.914 | 0.891 | 1.030 | 0.981 |
| Relative to external: | 0.287 | 0.234 | 0.187 | 0.304 | 0.295 | 0.245 |
| Unemployment benefit | 0.867 | 0.884 | 0.830 | 0.909 | 0.855 | 0.793 |
| Relative to external: | 6.096 | 6.151 | 6.457 | 6.634 | 6.545 | 6.501 |
-
Source: SIMPL model based on PHBS data 2006–2011 and external statistics (see endnote 2 for sources), weighted with baseline weights. Absolute values in millions.
PHBS and external statistics: SIMPL output macrovalidation for years 2006–2011 with baseline CSO weights.
| 2006 | 2007 | 2008 | 2009 | 2010 | 2011 | |
|---|---|---|---|---|---|---|
| Contributions and taxes, headcount | ||||||
| Retirement and disability SSC | 12.343 | 13.165 | 13.641 | 13.592 | 13.691 | 13.682 |
| relative to external | 1.036 | 1.100 | 1.105 | 1.076 | 1.069 | 1.063 |
| Health Insurance: | 20.041 | 20.644 | 21.206 | 21.146 | 21.158 | 21.121 |
| relative to external | 0.978 | 0.996 | 1.005 | 0.985 | 0.950 | 0.946 |
| - permanent employment | 10.108 | 10.980 | 11.569 | 11.382 | 11.539 | 11.639 |
| relative to external | 1.095 | 1.177 | 1.208 | 1.182 | 1.199 | 1.199 |
| - self-employment | 1.351 | 1.414 | 1.420 | 1.497 | 1.536 | 1.503 |
| relative to external | 0.926 | 0.904 | 0.861 | 0.885 | 0.881 | 0.833 |
| Personal income tax (PIT) | 21.791 | 22.312 | 22.657 | 22.569 | 22.495 | 22.433 |
| relative to external | 0.974 | 0.974 | 0.978 | 0.974 | 0.966 | 0.972 |
| - permanent employment | 8.015 | 8.618 | 9.115 | 8.767 | 8.460 | 6.881 |
| relative to external | 1.324 | 1.344 | 1.357 | 1.315 | 1.304 | 1.019 |
| - self-employment | 0.728 | 0.769 | 0.821 | 0.804 | 0.793 | 0.452 |
| relative to external | 2.931 | 3.141 | 3.398 | 2.780 | 2.441 | 1.310 |
| Child Tax Credit | - | 6.869 | 7.357 | 7.299 | 7.461 | 7.352 |
| relative to external | - | 1.142 | 1.157 | 1.163 | 1.187 | 1.168 |
| Benefit recipient, headcount | ||||||
| Family Allowance (FA) | 6.047 | 4.896 | 4.021 | 3.674 | 3.319 | 3.238 |
| relative to external | 1.316 | 1.148 | 1.067 | 1.108 | 1.105 | 1.170 |
| FA supplements: | ||||||
| - large families (SLF) | 1.582 | 1.374 | 1.222 | 1.092 | 0.964 | 0.645 |
| relative to external | 2.041 | 1.944 | 1.941 | 1.953 | 1.910 | 1.396 |
| - starting school (SSS) | 4.156 | 3.340 | 2.629 | 2.348 | 2.978 | 2.918 |
| relative to external | 1.300 | 1.107 | 1.089 | 0.980 | 1.395 | 1.440 |
| - child birth (SCB) | 0.232 | 0.219 | 0.176 | 0.158 | 0.156 | 0.154 |
| relative to external | 0.906 | 0.983 | 0.822 | 0.810 | 0.857 | 0.960 |
| - education of disabled child (SEDC) | 0.230 | 0.196 | 0.176 | 0.162 | 0.151 | 0.163 |
| relative to external | 0.999 | 0.897 | 0.866 | 0.871 | 0.874 | 1.006 |
-
Source: SIMPL model based on PHBS data 2006–2011 and external statistics (see endnote 2 for sources), weighted with baseline weights. Absolute values in millions.
Summary of calibration targets.
| System | Target variables | Description |
|---|---|---|
| S0 | – | Baseline weights |
| S1 | Household size | 6 groups by household size (1, 2, 3, 4, 5, 6+); |
| Place of residence | 2 groups: rural or urban; | |
| Age | 16 groups by 5 year threshold; | |
| S2: | S1 + recipients of 7 income sources (as declared in PHBS) | employee: permanent and temporary; self employment; pensions: pre-retirement, retirement, disability and family pensions; unemployment benefit; |
| S3: | S1 + recipients of 2 income sources: (as declared in PHBS) + SIMPL output: | all pensions; unemployment benefit; number of contributors to: Personal Income Tax; Health Insurance on permanent employment; Health Insurance on self-employment; |
PHBS and external statistics: Ratios of income sources (headcount) by weight calibration for 2006–2011.
| Income source and weights | 2006 | 2007 | 2008 | 2009 | 2010 | 2011 |
|---|---|---|---|---|---|---|
| Permanent employment | ||||||
| S0 | 1.159 | 1.196 | 1.194 | 1.183 | 1.200 | 1.198 |
| S1 | 1.222 | 1.261 | 1.267 | 1.264 | 1.273 | 1.271 |
| S2 | 1.000 | 1.000 | 1.000 | 1.000 | 1.000 | 1.000 |
| S3 | 1.085 | 1.062 | 1.030 | 1.034 | 1.036 | 1.031 |
| Temporary employment | ||||||
| S0 | 1.921 | 1.621 | 1.491 | 1.299 | 1.041 | 0.810 |
| S1 | 1.971 | 1.647 | 1.498 | 1.267 | 1.009 | 0.792 |
| S2 | 1.000 | 1.000 | 1.000 | 1.000 | 1.000 | 1.000 |
| S3 | 3.483 | 3.759 | 3.691 | 3.389 | 2.690 | 2.097 |
| Self employment | ||||||
| S0 | 0.702 | 0.729 | 0.693 | 0.739 | 0.758 | 0.746 |
| S1 | 0.706 | 0.733 | 0.699 | 0.749 | 0.770 | 0.770 |
| S2 | 1.000 | 1.000 | 1.000 | 1.000 | 1.000 | 1.000 |
| S3 | 0.779 | 0.839 | 0.830 | 0.860 | 0.887 | 0.922 |
| Farmer | ||||||
| S0 | 1.314 | 1.239 | 1.164 | 1.125 | 0.989 | 0.914 |
| S1 | 1.392 | 1.333 | 1.253 | 1.220 | 1.071 | 1.001 |
| S2 | 1.678 | 1.715 | 1.646 | 1.590 | 1.475 | 1.326 |
| S3 | 1.471 | 1.472 | 1.433 | 1.458 | 1.230 | 1.161 |
| Retirement pension | ||||||
| S0 | 1.038 | 1.023 | 1.043 | 1.040 | 1.030 | 1.033 |
| S1 | 1.071 | 1.077 | 1.092 | 1.085 | 1.086 | 1.085 |
| S2 | 1.000 | 1.000 | 1.000 | 1.000 | 1.000 | 1.000 |
| S3 | 1.053 | 1.061 | 1.069 | 1.063 | 1.067 | 1.071 |
| Disability pension | ||||||
| S0 | 1.048 | 1.021 | 1.009 | 0.986 | 0.967 | 0.972 |
| S1 | 1.050 | 1.034 | 1.025 | 1.020 | 0.995 | 1.011 |
| S2 | 1.000 | 1.000 | 1.000 | 1.000 | 1.000 | 1.000 |
| S3 | 1.007 | 0.999 | 1.012 | 1.013 | 0.992 | 0.998 |
| Family pension | ||||||
| S0 | 0.862 | 0.826 | 0.763 | 0.754 | 0.747 | 0.735 |
| S1 | 0.849 | 0.817 | 0.739 | 0.722 | 0.728 | 0.715 |
| S2 | 1.000 | 1.000 | 1.000 | 1.000 | 1.000 | 1.000 |
| S3 | 0.806 | 0.763 | 0.709 | 0.724 | 0.709 | 0.698 |
| Pre-retirement pension | ||||||
| S0 | 0.990 | 1.005 | 0.914 | 0.891 | 1.030 | 0.981 |
| S1 | 0.936 | 0.963 | 0.889 | 0.881 | 1.046 | 1.009 |
| S2 | 1.000 | 1.000 | 1.000 | 1.000 | 1.000 | 1.000 |
| S3 | 0.902 | 0.921 | 0.882 | 0.818 | 1.038 | 0.936 |
| Unemployment benefit | ||||||
| S0 | 0.867 | 0.884 | 0.830 | 0.909 | 0.855 | 0.793 |
| S1 | 0.880 | 0.900 | 0.845 | 0.952 | 0.886 | 0.812 |
| S2 | 1.000 | 1.000 | 1.000 | 1.000 | 1.000 | 1.000 |
| S3 | 1.000 | 1.000 | 1.000 | 1.000 | 1.000 | 1.000 |
-
Source: PHBS data 2006–2011 and external statistics (see endnote 2 for sources), weighted with baseline (S0) and calibrated (S1–S3) weights.
PHBS and external statistics: Ratios of contributions and taxes (amount) in SIMPL by weight calibration for 2006–2011.
| Simulation output and weights | 2006 | 2007 | 2008 | 2009 | 2010 | 2011 |
|---|---|---|---|---|---|---|
| Social security contribution (SSC) | ||||||
| S0 | 1.041 | 1.042 | 1.049 | 1.061 | 1.114 | 1.092 |
| S1 | 1.089 | 1.085 | 1.102 | 1.122 | 1.167 | 1.145 |
| S2 | 0.959 | 0.930 | 0.944 | 0.962 | 0.977 | 0.974 |
| S3 | 1.009 | 0.955 | 0.955 | 0.966 | 1.007 | 0.989 |
| Health insurance contributions (HI) | ||||||
| S0 | 0.954 | 0.937 | 0.945 | 0.940 | 0.937 | 0.913 |
| S1 | 0.985 | 0.971 | 0.985 | 0.985 | 0.977 | 0.952 |
| S2 | 0.899 | 0.865 | 0.873 | 0.872 | 0.852 | 0.839 |
| S3 | 0.922 | 0.873 | 0.878 | 0.876 | 0.869 | 0.851 |
| Personal Income Tax (PIT) | ||||||
| S0 | 0.917 | 0.901 | 0.843 | 0.812 | 0.882 | 0.849 |
| S1 | 0.920 | 0.926 | 0.869 | 0.854 | 0.922 | 0.892 |
| S2 | 0.919 | 0.923 | 0.844 | 0.816 | 0.872 | 0.843 |
| S3 | 0.875 | 0.866 | 0.808 | 0.775 | 0.844 | 0.818 |
| Child Tax Credit (in PIT) | ||||||
| S0 | – | 1.214 | 1.241 | 1.262 | 1.299 | 1.278 |
| S1 | – | 1.092 | 1.133 | 1.135 | 1.168 | 1.159 |
| S2 | – | 1.059 | 1.070 | 1.063 | 1.073 | 1.071 |
| S3 | – | 1.008 | 1.011 | 1.020 | 1.040 | 1.040 |
-
Source: PHBS data 2006–2011 and external statistics (see endnote 2 for sources), weighted with baseline (S0) and calibrated (S1–S3) weights.
PHBS and external statistics: Ratios of Family Benefits (amount) in SIMPL by weight calibration for 2006–2011.
| Simulation output and weights | 2006 | 2007 | 2008 | 2009 | 2010 | 2011 |
|---|---|---|---|---|---|---|
| Family Allowance (FA) | ||||||
| S0 | 1.319 | 1.154 | 1.072 | 1.124 | 1.112 | 1.174 |
| S1 | 1.149 | 0.988 | 0.835 | 0.873 | 0.843 | 0.872 |
| S2 | 1.174 | 1.045 | 0.960 | 1.024 | 1.004 | 1.059 |
| S3 | 1.164 | 1.049 | 0.976 | 0.999 | 1.023 | 1.062 |
| Family Allowance supplements: | ||||||
| - large families (SLF) | ||||||
| S0 | 1.425 | 1.344 | 1.344 | 1.359 | 1.346 | 1.397 |
| S1 | 1.162 | 1.093 | 0.841 | 0.848 | 0.781 | 0.779 |
| S2 | 1.032 | 0.960 | 0.891 | 0.895 | 1.005 | 0.910 |
| S3 | 1.003 | 0.949 | 0.937 | 1.026 | 0.901 | 0.935 |
| - starting school (SSS) | ||||||
| S0 | 1.216 | 1.107 | 1.089 | 0.980 | 1.395 | 1.441 |
| S1 | 1.045 | 0.931 | 0.831 | 0.747 | 0.710 | 0.701 |
| S2 | 1.069 | 0.980 | 0.956 | 0.879 | 0.833 | 0.856 |
| S3 | 1.062 | 0.983 | 0.971 | 0.850 | 0.859 | 0.864 |
| - child birth (SCB) | ||||||
| S0 | 1.024 | 0.984 | 0.822 | 0.810 | 0.857 | 0.960 |
| S1 | 0.935 | 0.883 | 0.665 | 0.657 | 0.680 | 0.741 |
| S2 | 0.964 | 0.913 | 0.727 | 0.756 | 0.803 | 0.858 |
| S3 | 1.004 | 0.963 | 0.793 | 0.790 | 0.780 | 0.814 |
| - education of disabled child (SEDC) | ||||||
| S0 | 1.063 | 0.904 | 0.862 | 0.874 | 0.866 | 1.009 |
| S1 | 0.919 | 0.758 | 0.671 | 0.681 | 0.669 | 0.702 |
| S2 | 1.020 | 0.849 | 0.790 | 0.828 | 0.825 | 0.885 |
| S3 | 1.039 | 0.904 | 0.890 | 0.838 | 0.864 | 0.982 |
| Child Birth Allowance (CBA): | ||||||
| S0 | 1.119 | 1.067 | 1.037 | 1.069 | 1.070 | 1.112 |
| S1 | 0.891 | 0.939 | 0.951 | 0.949 | 0.934 | 0.957 |
| S2 | 0.908 | 0.966 | 0.955 | 0.970 | 0.932 | 0.964 |
| S3 | 0.947 | 1.028 | 1.072 | 1.053 | 1.036 | 1.038 |
-
Source: PHBS data 2006–2011 and external statistics, weighted with baseline (S0) and calibrated (S1–S3) weights.
Elements of tax and benefit used as performance measures.
| Abbreviation | Full name |
|---|---|
| Taxes and contributions | |
| SSC | Social Security Contributions |
| HI | Health Insurance contributions |
| PIT | Personal Income Tax |
| CTC | Child Tax Credit (within PIT) |
| Family Benefits: | |
| FA | Family Allowance |
| SCB | FA Supplement for Child Birth |
| SEDC | FA Supplement for Education and Rehabilitation of Disabled Child |
| SLF | FA Supplement for Large Families |
| SSS | FA School Starting Supplement |
| CBA | Child Birth Allowance |
Minimum and maximum ratios of calibrated to baseline weights for calibration stages S1, S2 and S3.
| S1 | S2 | S3 | |||||||
|---|---|---|---|---|---|---|---|---|---|
| Max. | Min. | s.d. | Max. | Min. | s.d. | Max. | Min. | s.d. | |
| 2006 | 2.00 | 0.80 | (0.29) | 5.26 | 0.28 | (0.43) | 5.92 | 0.52 | (0.44) |
| 2007 | 2.00 | 0.80 | (0.32) | 4.69 | 0.33 | (0.47) | 3.96 | 0.15 | (0.55) |
| 2008 | 4.41 | 0.25 | (0.28) | 4.78 | 0.14 | (0.49) | 4.49 | 0.23 | (0.62) |
| 2009 | 2.45 | 0.44 | (0.29) | 2.62 | 0.23 | (0.47) | 5.72 | 0.38 | (0.62) |
| 2010 | 3.39 | 0.23 | (0.28) | 4.01 | 0.73 | (0.62) | 4.69 | 0.46 | (0.70) |
| 2011 | 3.04 | 0.17 | (0.28) | 3.75 | 0.40 | (0.48) | 3.16 | 0.15 | (0.62) |
| 2.00 | 0.80 | (0.29) | 5.26 | 0.28 | (0.43) | 5.92 | 0.52 | (0.44) | |
-
Source: Authors’ calculations using PHBS data 2006–2011 and external statistics (see endnote 2 for sources), weighted with baseline (S0) and calibrated (S1–S3) weights. Standard deviation in brackets.