A microsimulation model to evaluate Italian households’ financial vulnerability
- Institute Bank of Italy, Financial Stability Directorate, Via Nazionale, Italy
- Article
- Figures and data
- Jump to
Figures

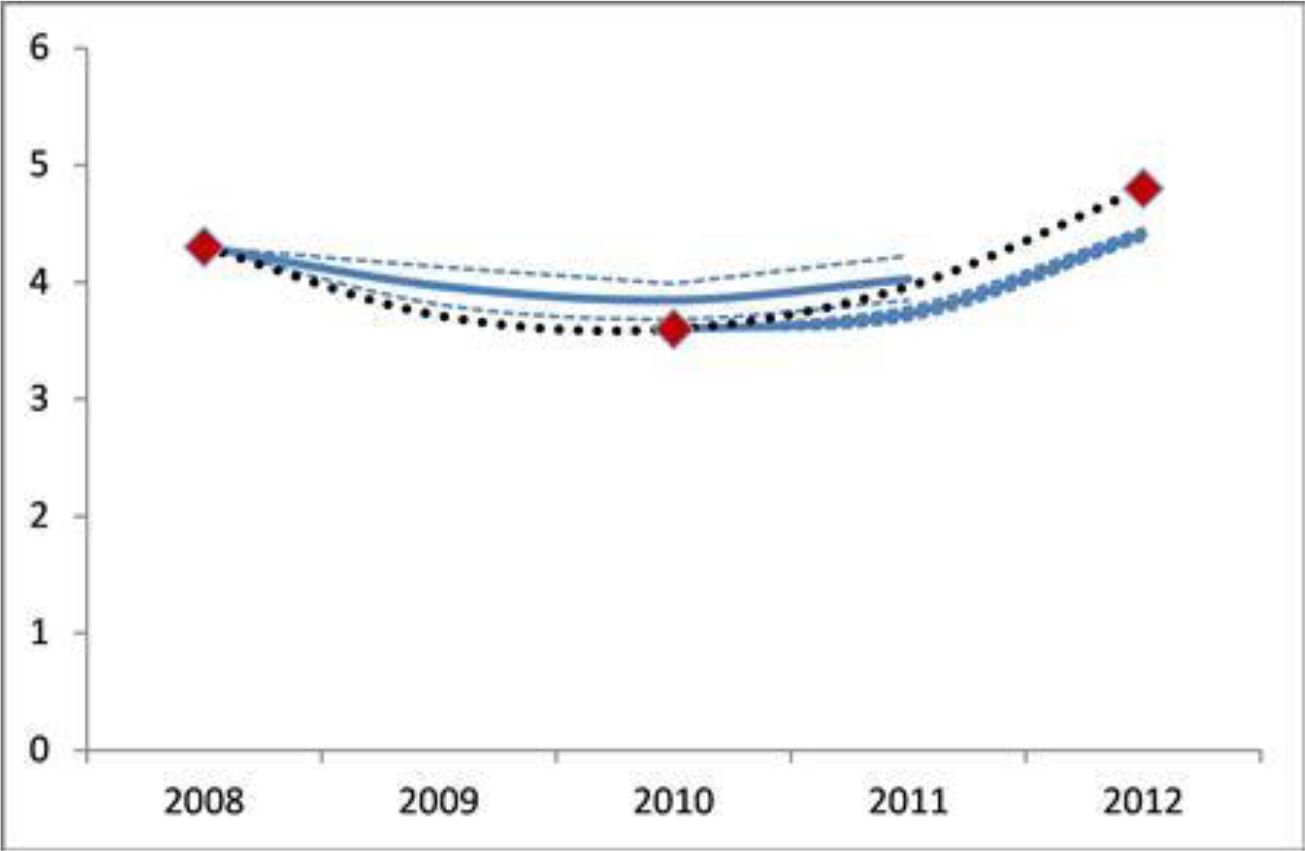
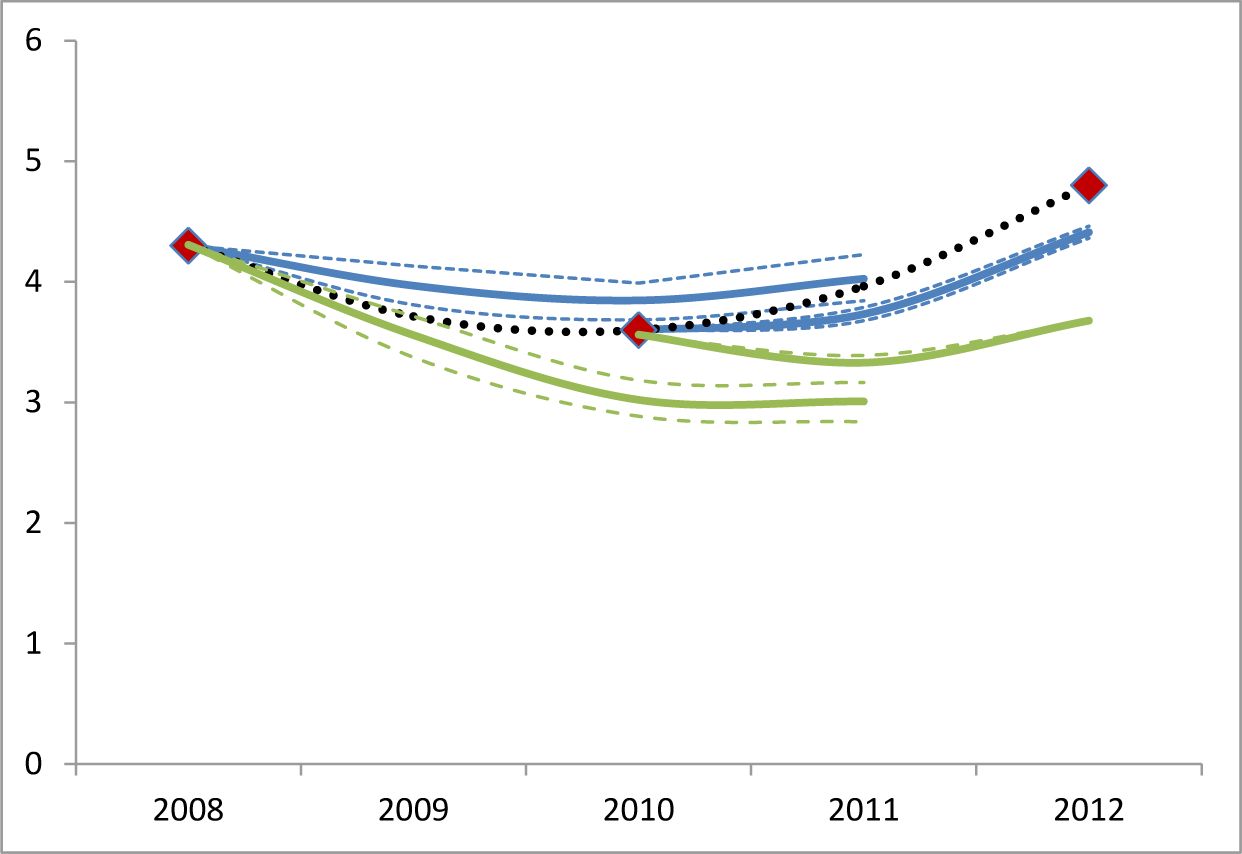
Percentage of vulnerable households in the population.
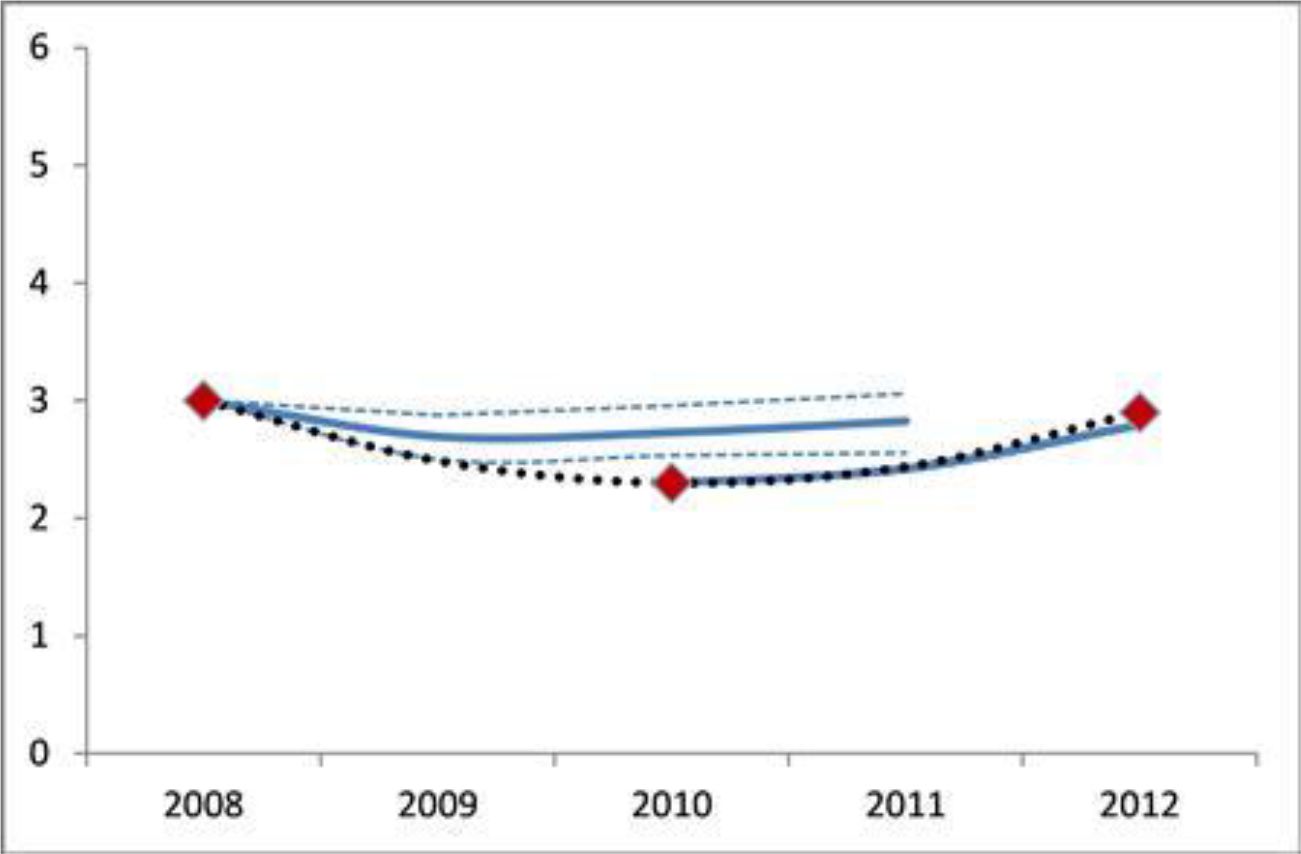
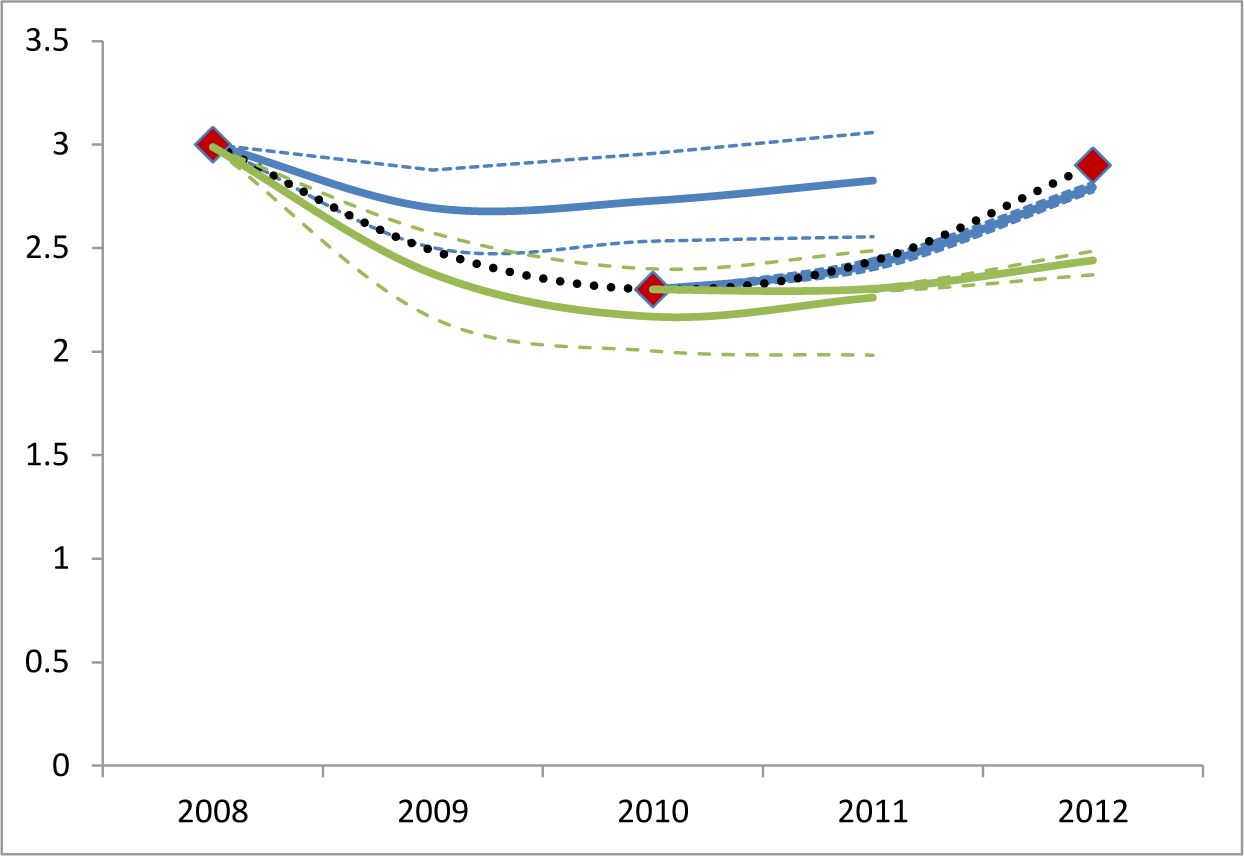
Percentage of vulnerable households with income below the median.
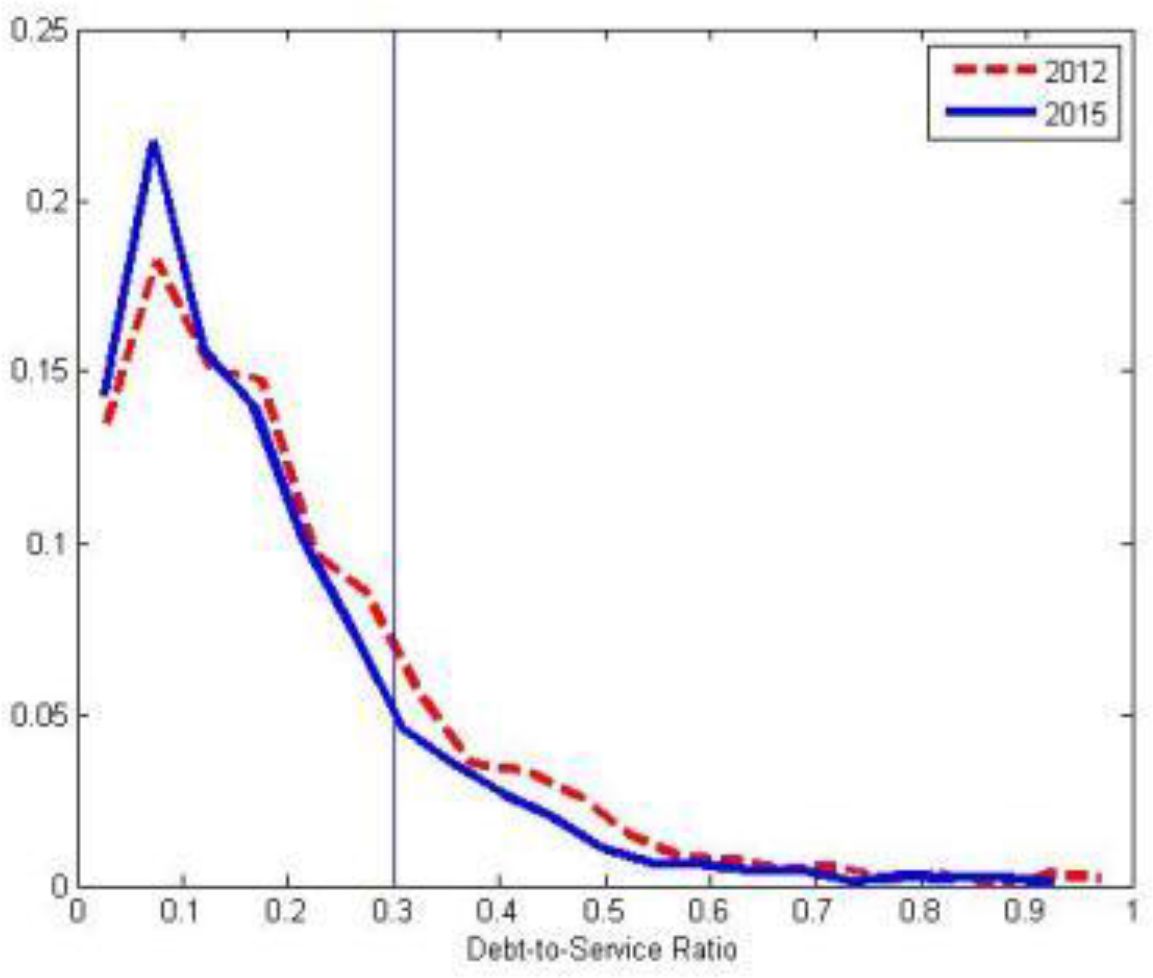
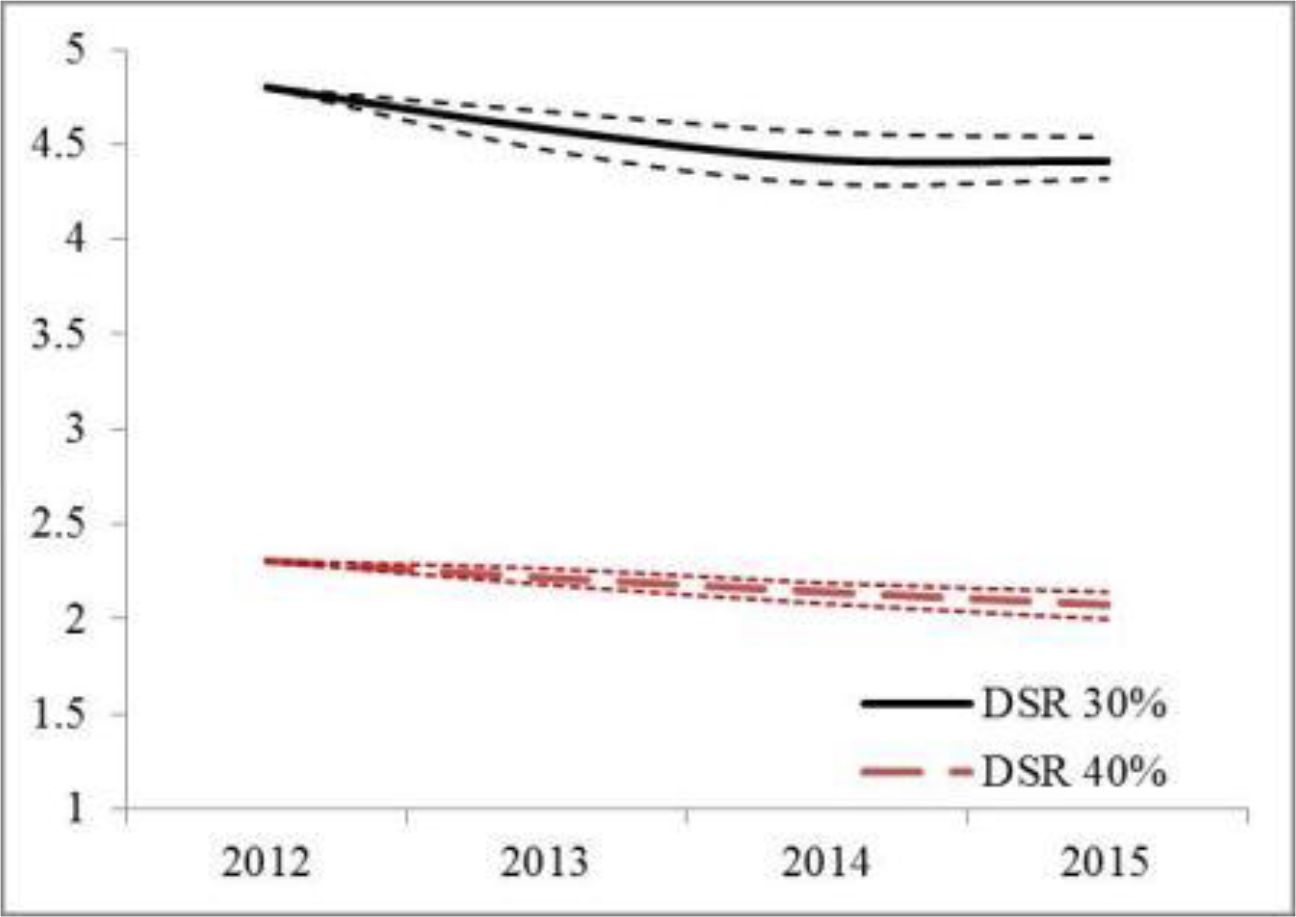
DSR Distribution.
Percentage of vulnerable households in the population.
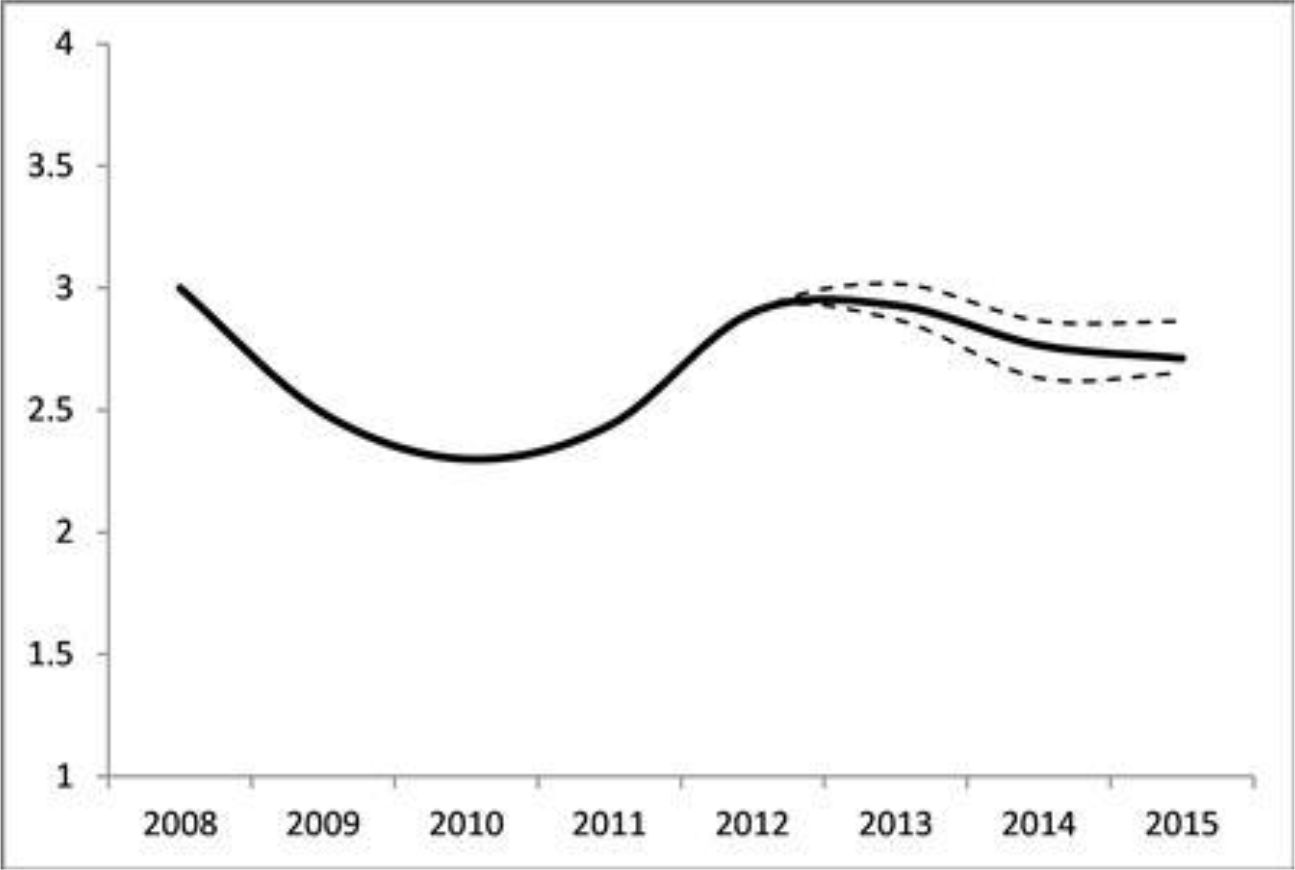
Percentage of vulnerable households with income below the median in total households.
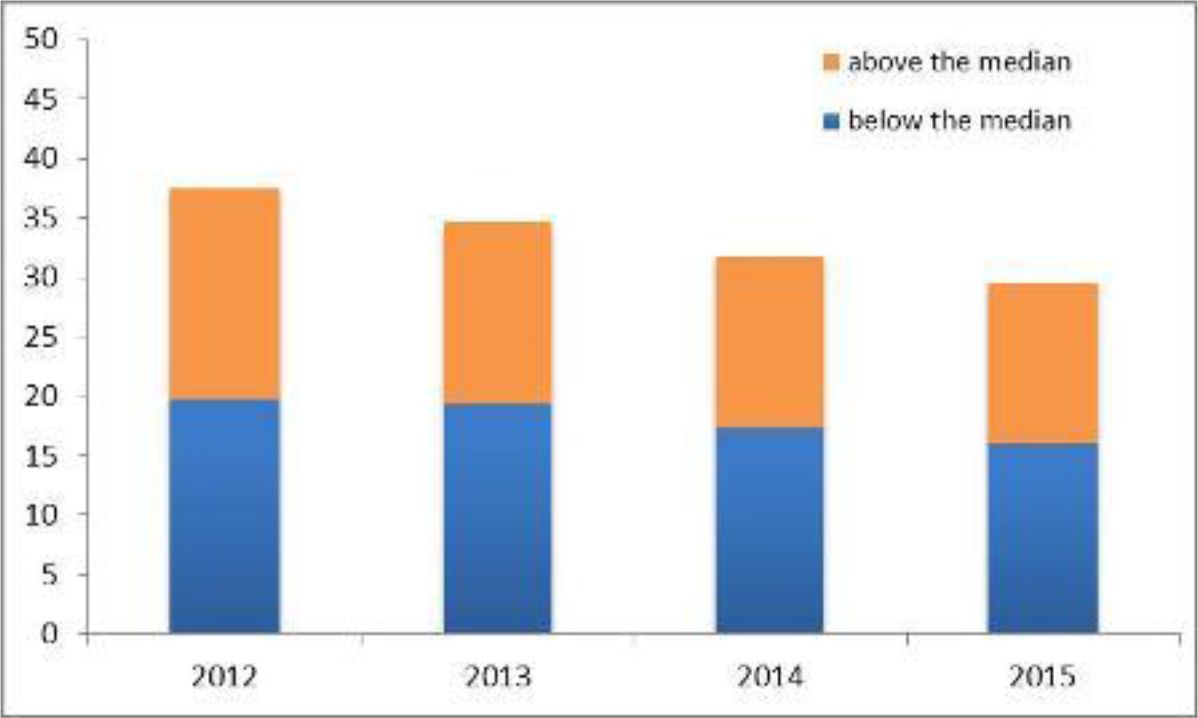
Percentage of debt held by all vulnerable households.
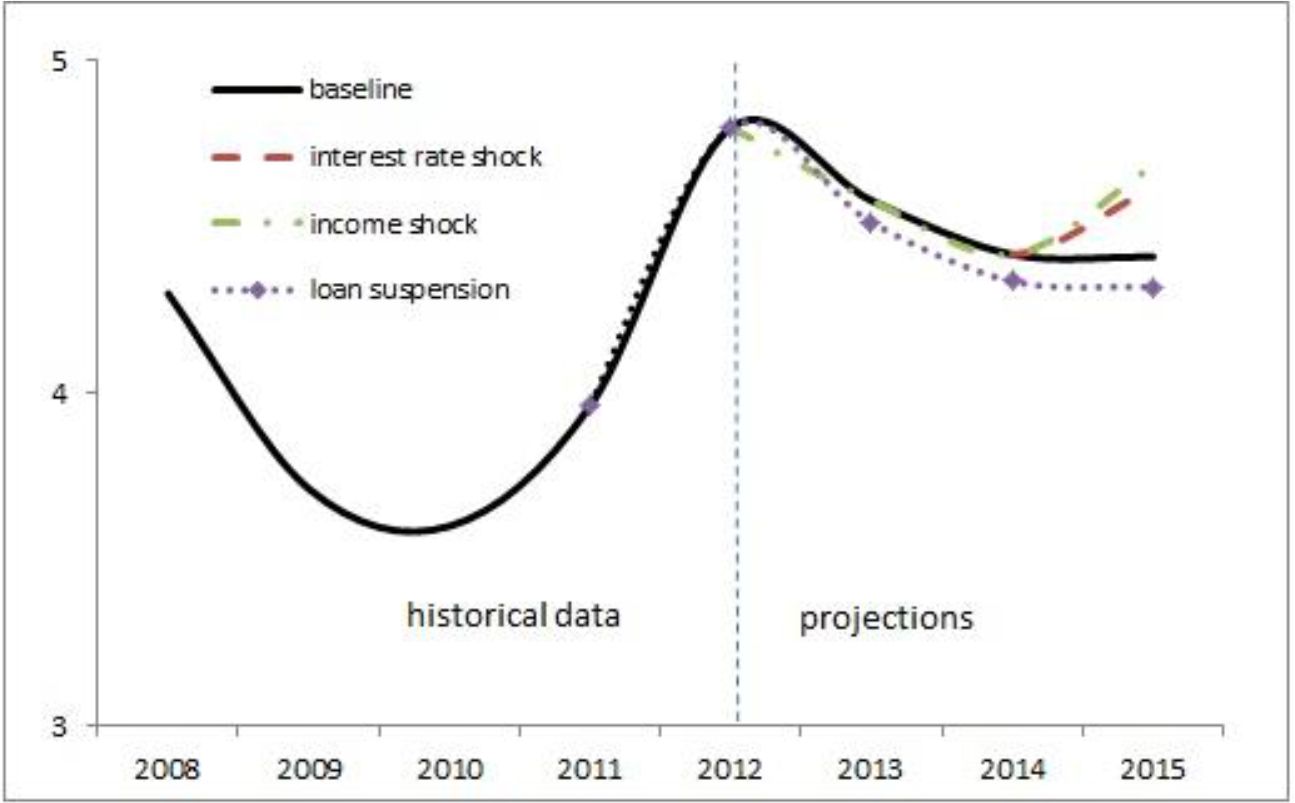
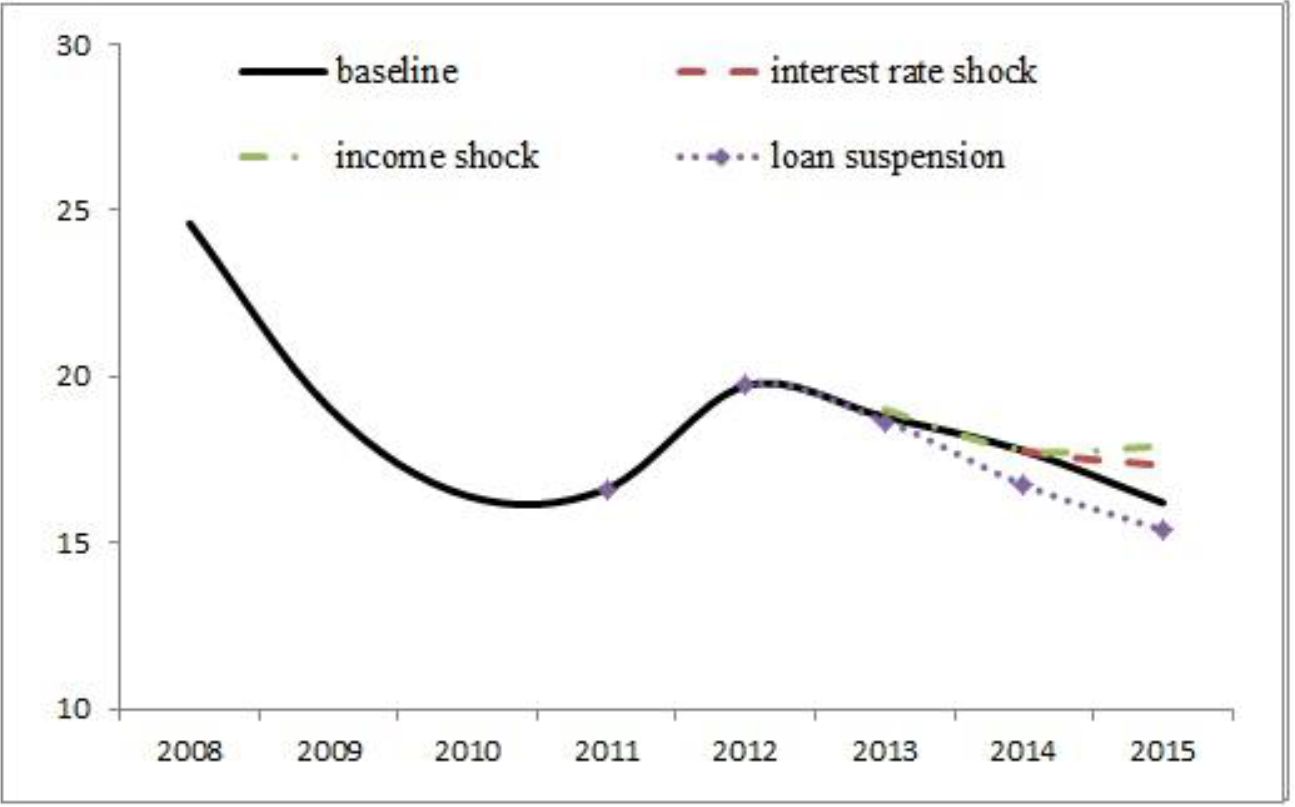
Percentage of vulnerable households under alternative scenarios.

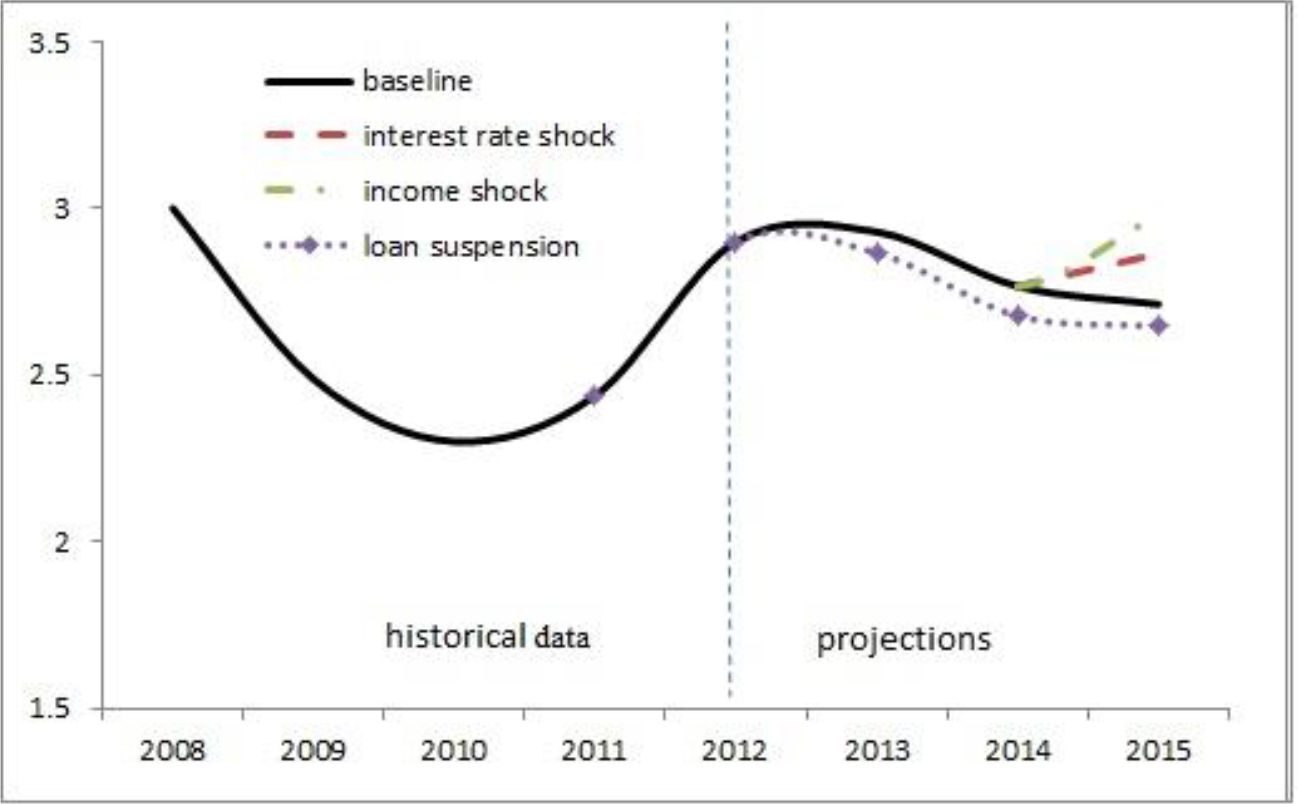
Percentage of vulnerable households with income below the median under alternative scenarios.

Percentage of total debt held by vulnerable households with income below the median.
Percentage of vulnerable households with DSR above 40%.

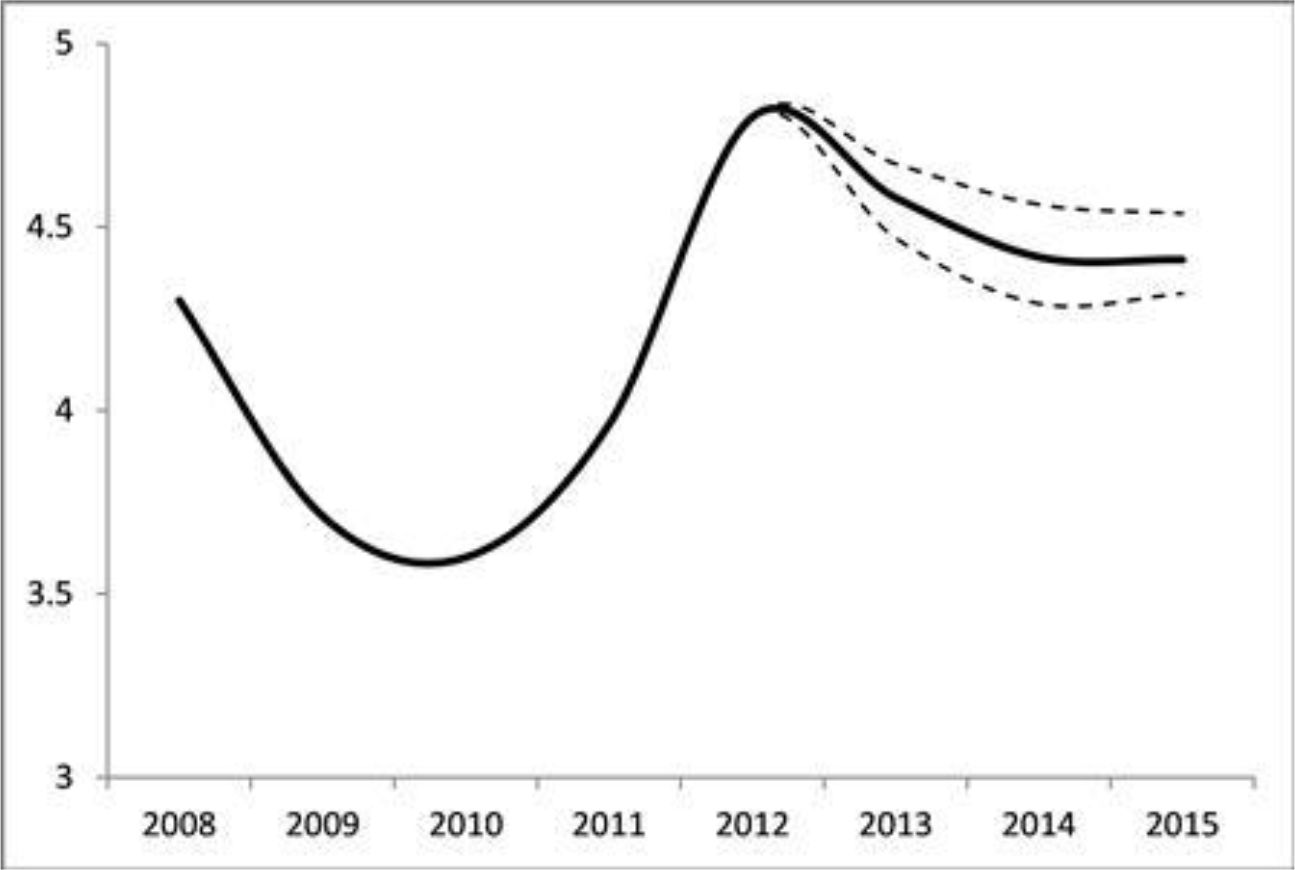
Percentage of vulnerable households over total population.
Percentage of vulnerable households with income below the median over total population.
Note: The blue lines represent projections assuming a French amortization schedule; the green lines are projections assuming a fixed share of principal on current credit balance.
Tables
Macroeconomic aggregates (Percentages).
| 2013 | 2014 | 2015 | |
| Income growth rate at current prices (national accounts) | 0.1 | 2.4 | 2.9 |
| Total debt growth (macro model for forecasting debt growth) | -1.0 | -0.3 | 1.8 |
| Euribor (3m Euribor and 3m Euribor futures) | 0.21 | 0.27 | 0.32 |
| Euribor change | -0.65 | 0.06 | 0.05 |
Estimated mean and standard deviation for the income process.
| yd growth | y growth | |||
|---|---|---|---|---|
| μd | σd | μ | σ | |
| 1st – 25th percentile | 0.035 | 0.034 | 0.039 | 0.025 |
| 25th – 50th percentile | 0.029 | 0.023 | 0.029 | 0.025 |
| 50th – 75th percentile | 0.026 | 0.026 | 0.025 | 0.023 |
| 75th – 100th percentile | 0.025 | 0.024 | 0.023 | 0.024 |
Adjustment factors for households’ income.
| 2013 | 2014 | 2015 | |
| Adjustment factor | 0.974 | 0.970 | 0.971 |
Income growth (Percentages).
| 2013 | 2014 | 2015 | |
| National accounts | 0.1 | 2.4 | 2.9 |
| Model | 0.1 | 2.4 | 2.9 |
Total debt growth (Percentages).
| 2013 | 2014 | 2015 | |
| Macro | -1.0 | -0.3 | 1.8 |
| Model with originations | -1.0 | -0.3 | 1.8 |
| Model without originations | -5.1 | -5.7 | -6.1 |
Percentage of vulnerable households by age, education and occupation (Mean values).
| 2012 | 2013 | 2014 | 2015 | Total population (2012) | |
|---|---|---|---|---|---|
| Age | |||||
| < 35 | 16.8 | 14.2 | 12.9 | 10.7 | 9.5 |
| 35–44 | 33.5 | 31.1 | 29.3 | 28.9 | 20.2 |
| 45–54 | 28.4 | 32.7 | 35.0 | 35.7 | 21.3 |
| 55–64 | 9.4 | 9.6 | 11.0 | 12.2 | 16.2 |
| > 65 | 11.9 | 11.9 | 11.3 | 12.1 | 32.8 |
| Education | |||||
| No education or primary education | 6.2 | 6.3 | 6.3 | 6.1 | 23.3 |
| Lower secondary education | 39.7 | 38.4 | 38.3 | 36.0 | 35.8 |
| Upper secondary education | 39.7 | 40.7 | 41.2 | 45.3 | 27.8 |
| Undergraduate or post-graduate | 14.5 | 14.8 | 14.4 | 13.6 | 13.1 |
| Occupation | |||||
| Not working | 16.0 | 15.7 | 15.1 | 14.4 | 41.0 |
| Working | 84.0 | 84.2 | 84.4 | 85.4 | 59.0 |
Percentage of vulnerable households under alternative scenarios.
| 2012 | 2013 | 2014 | 2015 | ||||
|---|---|---|---|---|---|---|---|
| Baseline | Suspension of payments | Interest rate shock | Income shock | ||||
| Central estimate | 4.8 | 4.6 | 4.4 | 4.4 | 4.3 | 4.6 | 4.7 |
| 10th-90th percentiles | -- | 4.5–4.7 | 4.3–4.6 | 4.3–4.5 | 4.2–4.5 | 4.5–4.7 | 4.6–4.8 |
Percentage of vulnerable households with income below the median under alternative scenarios.
| 2012 | 2013 | 2014 | 2015 | ||||
|---|---|---|---|---|---|---|---|
| Baseline | Suspension of payments | Interest rate shock | Income shock | ||||
| Central estimate | 2.9 | 2.9 | 2.8 | 2.7 | 2.6 | 2.9 | 3.0 |
| 10th-90th percentiles | -- | 2.9–3.0 | 2.6–2.9 | 2.7–2.9 | 2.6–2.8 | 2.7–3.0 | 2.9–3.1 |
| 2012 | 2013 | 2014 | 2015 | |
|---|---|---|---|---|
| Percentage of vulnerable households over total households | ||||
| 1st–25th percentile | 1.5 | 1.6 | 1.6 | 1.6 |
| 25th–50th percentile | 1.4 | 1.4 | 1.2 | 1.1 |
| Below the median | 2.9 | 2.9 | 2.8 | 2.7 |
| 50th–75th percentile | 1.2 | 1.0 | 0.9 | 0.8 |
| 75th–100th percentile | 0.7 | 0.7 | 0.7 | 0.8 |
| TOTAL | 4.8 | 4.6 | 4.4 | 4.4 |
| Percentage of vulnerable households over indebted households | ||||
| 1st–25th percentile | 7.6 | 7.4 | 6.8 | 6.7 |
| 25th–50th percentile | 7.0 | 6.3 | 5.2 | 4.6 |
| Below the median | 14.6 | 13.6 | 12.0 | 11.2 |
| 50th–75th percentile | 6.0 | 4.4 | 3.8 | 3.3 |
| 75th–100th percentile | 3.5 | 3.0 | 3.2 | 3.3 |
| TOTAL | 24.1 | 21.2 | 19.1 | 18.1 |
| Percentage of debt held by vulnerable households | ||||
| 1st–25th percentile | 9.5 | 10.4 | 9.7 | 9.2 |
| 25th–50th percentile | 10.2 | 9.1 | 7.9 | 7.0 |
| Below the median | 19.7 | 19.3 | 17.4 | 16.0 |
| 50th–75th percentile | 7.9 | 6.4 | 5.9 | 5.2 |
| 75th–100th percentile | 9.8 | 9.1 | 8.7 | 8.2 |
| TOTAL | 37.5 | 34.7 | 31.8 | 29.5 |
-
Note: Households are divided into classes according to their equalized income gross of imputed rents. The reported values have been approximated to the first decimal.
| 2012 | 2013 | 2014 | 2015 | |
|---|---|---|---|---|
| Percentage of vulnerable households over total households | ||||
| 1st–25th percentile | 1.5 | 1.6 | 1.5 | 1.6 |
| 25th–50th percentile | 1.4 | 1.3 | 1.2 | 1.1 |
| Below the median | 2.9 | 2.9 | 2.7 | 2.6 |
| 50th–75th percentile | 1.2 | 1.0 | 0.9 | 0.8 |
| 75th–100th percentile | 0.7 | 0.7 | 0.7 | 0.8 |
| TOTAL | 4.8 | 4.5 | 4.3 | 4.3 |
| Percentage of vulnerable households over indebted households | ||||
| 1st–25th percentile | 7.6 | 7.2 | 6.5 | 6.4 |
| 25th–50th percentile | 7.0 | 6.2 | 5.2 | 4.4 |
| Below the median | 14.6 | 13.3 | 11.6 | 10.9 |
| 50th–75th percentile | 6.0 | 4.4 | 3.8 | 3.3 |
| 75th–100th percentile | 3.5 | 3.0 | 3.2 | 3.3 |
| TOTAL | 24.1 | 20.9 | 18.8 | 17.8 |
| Percentage of debt held by vulnerable households | ||||
| 1st–25th percentile | 9.5 | 10.1 | 9.1 | 8.8 |
| 25th–50th percentile | 10.2 | 8.9 | 7.9 | 6.8 |
| Below the median | 19.7 | 18.7 | 16.7 | 15.4 |
| 50th–75th percentile | 7.9 | 6.4 | 5.9 | 5.2 |
| 75th–100th percentile | 9.8 | 9.1 | 8.7 | 8.2 |
| TOTAL | 37.5 | 34.0 | 31.4 | 29.1 |
| 2012 | 2013 | 2014 | 2015 | |
|---|---|---|---|---|
| Percentage of vulnerable households over total households | ||||
| 1st–25th percentile | 1.5 | 1.6 | 1.6 | 1.7 |
| 25th–50th percentile | 1.4 | 1.4 | 1.2 | 1.2 |
| Below the median | 2.9 | 2.9 | 2.8 | 2.9 |
| 50th–75th percentile | 1.2 | 1.0 | 0.9 | 0.9 |
| 75th–100th percentile | 0.7 | 0.7 | 0.7 | 0.8 |
| TOTAL | 4.8 | 4.6 | 4.4 | 4.6 |
| Percentage of vulnerable households over indebted households | ||||
| 1st–25th percentile | 7.6 | 7.4 | 6.8 | 6.9 |
| 25th–50th percentile | 7.0 | 6.3 | 5.2 | 4.9 |
| Below the median | 14.6 | 13.6 | 12.0 | 11.8 |
| 50th–75th percentile | 6.0 | 4.4 | 3.8 | 3.5 |
| 75th–100th percentile | 3.5 | 3.0 | 3.2 | 3.4 |
| TOTAL | 24.1 | 21.2 | 19.1 | 19.0 |
| Percentage of debt held by vulnerable households | ||||
| 1st–25th percentile | 9.5 | 10.4 | 9.7 | 9.7 |
| 25th–50th percentile | 10.2 | 9.1 | 7.9 | 7.6 |
| Below the median | 19.7 | 19.3 | 17.4 | 17.1 |
| 50th–75th percentile | 7.9 | 6.4 | 5.9 | 5.7 |
| 75th–100th percentile | 9.8 | 9.1 | 8.7 | 8.7 |
| TOTAL | 37.5 | 34.7 | 31.8 | 31.4 |
| 2012 | 2013 | 2014 | 2015 | |
|---|---|---|---|---|
| Percentage of vulnerable households over total households | ||||
| 1st–25th percentile | 1.5 | 1.6 | 1.6 | 1.7 |
| 25th–50th percentile | 1.4 | 1.4 | 1.2 | 1.3 |
| Below the median | 2.9 | 2.9 | 2.8 | 3.0 |
| 50th–75th percentile | 1.2 | 1.0 | 0.9 | 0.9 |
| 75th–100th percentile | 0.7 | 0.7 | 0.7 | 0.7 |
| TOTAL | 4.8 | 4.6 | 4.4 | 4.7 |
| Percentage of vulnerable households over indebted households | ||||
| 1st–25th percentile | 7.6 | 7.4 | 6.8 | 6.9 |
| 25th–50th percentile | 7.0 | 6.3 | 5.2 | 5.4 |
| Below the median | 14.6 | 13.6 | 12.0 | 12.3 |
| 50th–75th percentile | 4.0 | 4.4 | 3.8 | 3.8 |
| 75th–100th percentile | 3.5 | 3.0 | 3.2 | 3.0 |
| TOTAL | 24.1 | 21.2 | 19.1 | 19.3 |
| Percentage of debt held by vulnerable households | ||||
| 1st–25th percentile | 9.5 | 10.4 | 9.7 | 9.5 |
| 25th–50th percentile | 10.2 | 9.1 | 7.9 | 8.0 |
| Below the median | 19.7 | 19.3 | 17.4 | 17.3 |
| 50th–75th percentile | 7.9 | 6.4 | 5.9 | 5.5 |
| 75th–100th percentile | 9.8 | 9.1 | 8.7 | 8.2 |
| TOTAL | 37.5 | 34.7 | 31.8 | 31.2 |
| 2012 | 2013 | 2014 | 2015 | |
|---|---|---|---|---|
| Percentage of vulnerable households over total households | ||||
| 1st–25th percentile | 1.0 | 1.0 | 1.0 | 1.0 |
| 25th–50th percentile | 0.6 | 0.6 | 0.5 | 0.5 |
| Below the median | 1.6 | 1.6 | 1.5 | 1.4 |
| 50th–75th percentile | 0.4 | 0.3 | 0.3 | 0.3 |
| 75th–100th percentile | 0.3 | 0.3 | 0.3 | 0.3 |
| TOTAL | 2.3 | 2.2 | 2.1 | 2.1 |
| Percentage of vulnerable households over indebted households | ||||
| 1st–25th percentile | 4.8 | 4.5 | 4.2 | 4.1 |
| 25th–50th percentile | 3.1 | 2.7 | 2.2 | 1.9 |
| Below the median | 7.9 | 7.3 | 6.4 | 5.9 |
| 50th–75th percentile | 2.1 | 1.6 | 1.3 | 1.2 |
| 75th–100th percentile | 1.5 | 1.3 | 1.3 | 1.3 |
| TOTAL | 11.5 | 10.2 | 9.2 | 8.5 |
| Percentage of debt held by vulnerable households | ||||
| 1st–25th percentile | 6.6 | 6.9 | 6.3 | 5.8 |
| 25th–50th percentile | 4.9 | 4.2 | 3.6 | 3.0 |
| Below the median | 11.5 | 11.1 | 9.9 | 8.6 |
| 50th–75th percentile | 3.4 | 3.0 | 2.5 | 2.1 |
| 75th–100th percentile | 3.3 | 3.1 | 3.1 | 2.9 |
| TOTAL | 18.2 | 17.1 | 15.7 | 13.8 |
| 2012 | 2013 | 2014 | 2015 | ||
|---|---|---|---|---|---|
| Percentage of vulnerable households over total households | |||||
| 1st–25th percentile | 1.5 | 1.6 | 1.4 | 1.3 | |
| 25th–50th percentile | 1.4 | 1.4 | 1.2 | 1.0 | |
| Below the median | 2.9 | 2.9 | 2.6 | 2.3 | |
| 50th–75th percentile | 1.2 | 1.0 | 0.9 | 0.8 | |
| 75th–100th percentile | 0.7 | 0.7 | 0.7 | 0.8 | |
| TOTAL | 4.8 | 4.6 | 4.3 | 4.0 | |
| Percentage of vulnerable households over indebted households | |||||
| 1st–25th percentile | 7.6 | 8.0 | 7.5 | 7.0 | |
| 25th–50th percentile | 7.0 | 6.9 | 6.1 | 5.1 | |
| Below the median | 14.6 | 14.7 | 13.5 | 12.1 | |
| 50th–75th percentile | 6.0 | 4.8 | 4.5 | 4.2 | |
| 75th–100th percentile | 3.5 | 3.3 | 3.7 | 4.1 | |
| TOTAL | 24.1 | 23.0 | 21.9 | 20.8 | |
| Percentage of debt held by vulnerable households | |||||
| 1st–25th percentile | 9.5 | 10.7 | 10.1 | 9.7 | |
| 25th–50th percentile | 10.2 | 9.4 | 8.6 | 7.4 | |
| Below the median | 19.7 | 19.9 | 18.3 | 16.9 | |
| 50th–75th percentile | 7.9 | 6.7 | 6.5 | 6.1 | |
| 75th–100th percentile | 9.8 | 9.4 | 9.6 | 9.7 | |
| TOTAL | 37.5 | 35.9 | 34.1 | 32.8 | |
| 2012 | 2013 | 2014 | 2015 | |
|---|---|---|---|---|
| Percentage of vulnerable households over total households | ||||
| 1st–25th percentile | 1.5 | 1.6 | 1.6 | 1.6 |
| 25th–50th percentile | 1.4 | 1.3 | 1.2 | 1.1 |
| Below the median | 2.9 | 2.9 | 2.7 | 2.7 |
| 50th–75th percentile | 1.2 | 0.9 | 0.9 | 0.8 |
| 75th–100th percentile | 0.7 | 0.7 | 0.7 | 0.8 |
| TOTAL | 4.8 | 4.5 | 4.4 | 4.4 |
| Percentage of vulnerable households over indebted households | ||||
| 1st–25th percentile | 7.6 | 7.4 | 6.8 | 6.6 |
| 25th–50th percentile | 7.0 | 6.2 | 5.1 | 4.5 |
| Below the median | 14.6 | 13.4 | 11.9 | 11.2 |
| 50th–75th percentile | 6.0 | 4.2 | 3.8 | 3.3 |
| 75th–100th percentile | 3.5 | 3.0 | 3.1 | 3.3 |
| TOTAL | 24.1 | 20.8 | 18.9 | 18.0 |
| Percentage of debt held by vulnerable households | ||||
| 1st–25th percentile | 9.5 | 10.4 | 9.6 | 9.2 |
| 25th–50th percentile | 10.2 | 8.9 | 7.8 | 6.9 |
| Below the median | 19.7 | 18.9 | 17.2 | 15.9 |
| 50th–75th percentile | 7.9 | 6.3 | 5.8 | 5.2 |
| 75th–100th percentile | 9.8 | 8.9 | 8.6 | 8.2 |
| TOTAL | 37.5 | 34.2 | 31.3 | 29.3 |
-
Note: we randomly assigned a fraction of individuals declaring a fixed rate mortgage to hold a variable rate mortgage so that about 70 per cent of the mortgages are at variable rate. We also assume that the credit loans are adjustable rate.
Estimated mean and standard deviation for the income process (SHIW 2008-2012).
| yd growth | y growth | |||
|---|---|---|---|---|
| μd | σd | μ | σ | |
| 1st – 25th percentile | -0.020 | 0.040 | -0.028 | 0.032 |
| 25th – 50th percentile | -0.014 | 0.029 | -0.016 | 0.025 |
| 50th – 75th percentile | -0.014 | 0.036 | -0.014 | 0.025 |
| 75th – 100th percentile | -0.010 | 0.029 | -0.011 | 0.001 |
| 2012 | 2013 | 2014 | 2015 | |
|---|---|---|---|---|
| Percentage of vulnerable households over total households | ||||
| 1st–25th percentile | 1.5 | 1.6 | 1.7 | 1.8 |
| 25th–50th percentile | 1.4 | 1.4 | 1.3 | 1.2 |
| Below the median | 2.9 | 3.0 | 3.0 | 3.0 |
| 50th–75th percentile | 1.2 | 0.9 | 0.9 | 0.8 |
| 75th–100th percentile | 0.7 | 0.7 | 0.7 | 0.7 |
| TOTAL | 4.8 | 4.6 | 4.5 | 4.6 |
| Percentage of vulnerable households over indebted households | ||||
| 1st–25th percentile | 7.6 | 7.5 | 7.3 | 7.3 |
| 25th–50th percentile | 7.0 | 6.4 | 5.5 | 4.9 |
| Below the median | 14.6 | 13.9 | 12.8 | 12.4 |
| 50th–75th percentile | 6.0 | 4.4 | 3.8 | 3.4 |
| 75th–100th percentile | 3.5 | 3.0 | 2.9 | 3.0 |
| TOTAL | 24.1 | 21.4 | 19.6 | 18.9 |
| Percentage of debt held by vulnerable households | ||||
| 1st–25th percentile | 9.5 | 10.5 | 10.0 | 9.8 |
| 25th–50th percentile | 10.2 | 9.3 | 8.5 | 7.5 |
| Below the median | 19.7 | 19.7 | 18.4 | 17.1 |
| 50th–75th percentile | 7.9 | 6.2 | 5.7 | 5.1 |
| 75th–100th percentile | 9.8 | 9.1 | 7.8 | 7.8 |
| TOTAL | 37.5 | 35.0 | 32.0 | 30.2 |
-
Note: we randomly assigned a fraction of individuals declaring a fixed rate mortgage to hold a variable rate mortgage so that about 70 percent of the mortgages are at variable rate. We also assume that the credit loans are adjustable rate.