LifeLossMOD: A microsimulation model of the economic impacts of premature mortality in Australia
- NHMRC Clinical Trials Centre, University of Sydney, Australia
Cite this article
as: H. E Carter, D. J Schofield, R. Shrestha; 2014; LifeLossMOD: A microsimulation model of the economic impacts of premature mortality in Australia; International Journal of Microsimulation; 7(3); 33-52.
doi: 10.34196/ijm.00106
- Article
- Figures and data
- Jump to
Figures
Figure 1
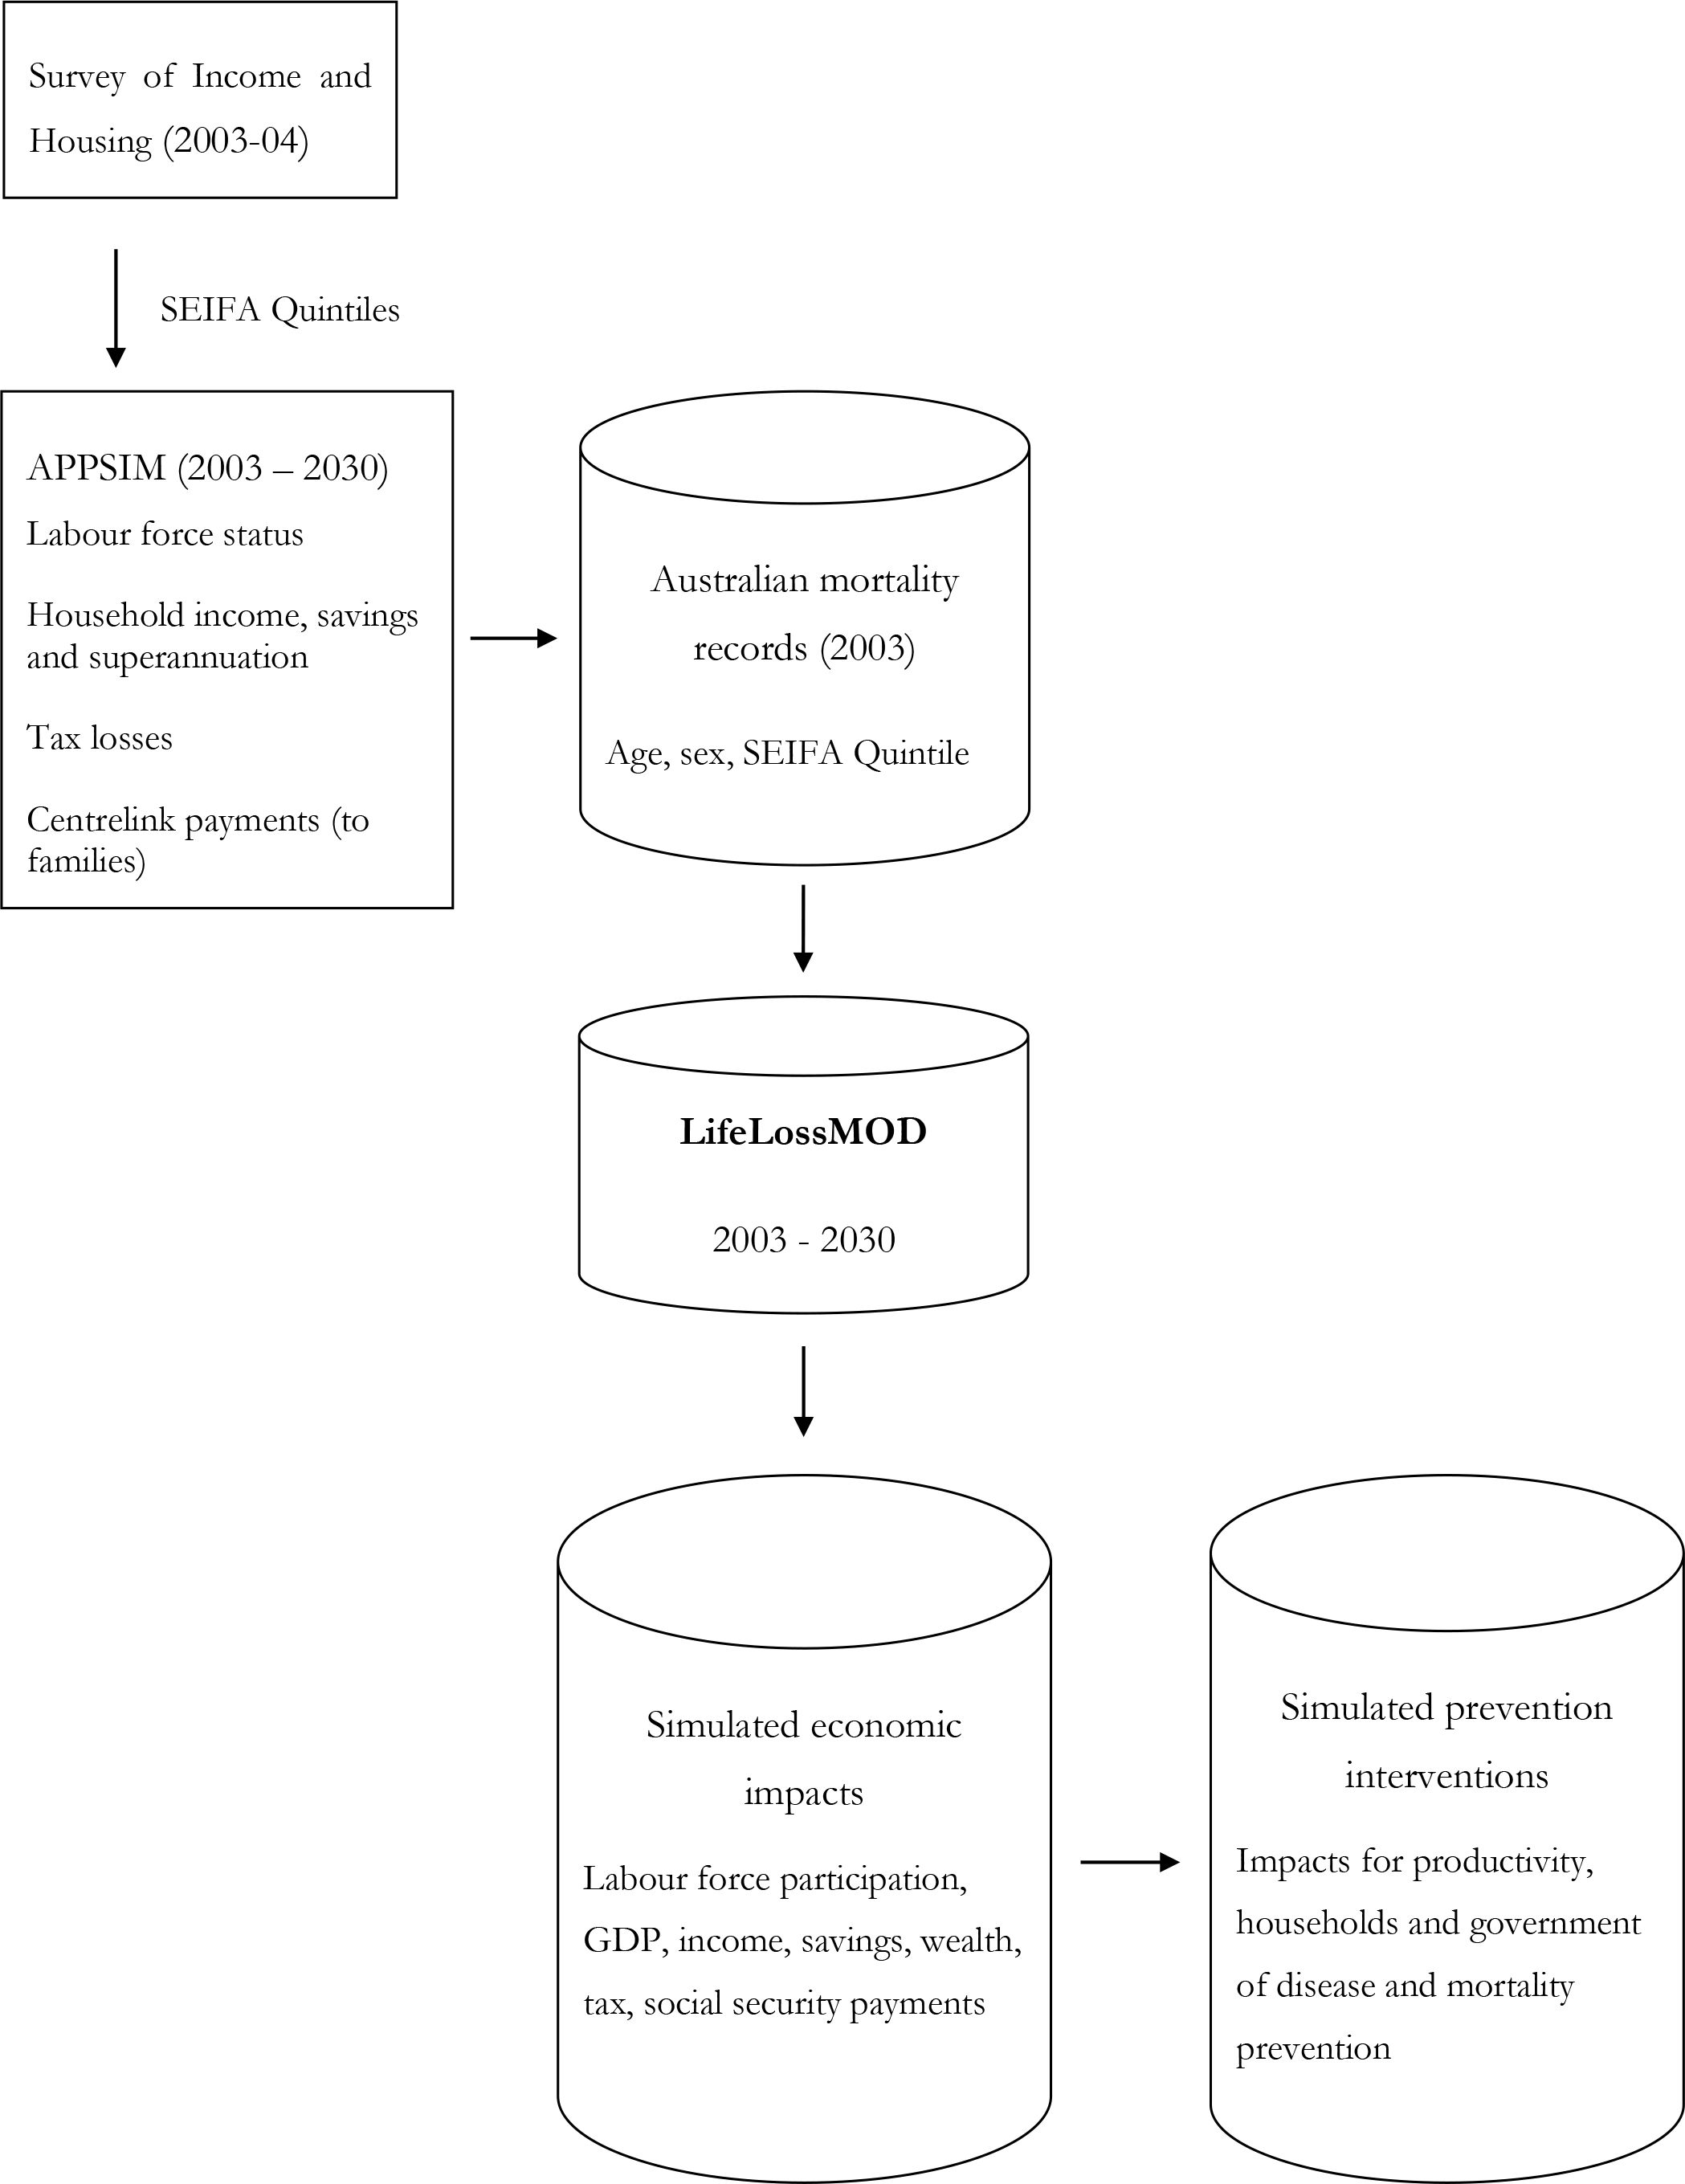

LifeLossMOD.
Tables
Table 1
Number of premature deaths in the 2003 mortality cohort by age and sex.
| Age Group | Male | Female | Total |
|---|---|---|---|
| < 15 | 954 | 738 | 1,692 |
| 15–24 | 1,028 | 370 | 1,398 |
| 25–34 | 1,455 | 591 | 2,046 |
| 35–44 | 2,259 | 1,246 | 3,505 |
| 45–54 | 4,012 | 2,454 | 6,466 |
| 55–64 | 7,549 | 4,468 | 12,062 |
| 64–80 | 25,027 | 16,508 | 41,535 |
| TOTAL | 42,329 | 26,375 | 68,704 |
Table 2
Benchmark analyses (in %).
| Benchmark category | Proportion in aggregate Aust. mortality data | Proportion in LifeLossMOD * | Absolute difference in overall proportions |
|---|---|---|---|
| Marital status | |||
| Never married | 18 | 26 | 7 |
| Married | 52 | 50 | 2 |
| Widowed | 16 | 17 | 1 |
| Divorced | 11 | 7 | 3 |
| Not stated | 3 | - | - |
| State of usual residence | |||
| NSW | 35 | 36 | 1 |
| Vic | 24 | 25 | 0 |
| Qld | 18 | 18 | 0 |
| SA | 9 | 8 | 1 |
| WA | 9 | 9 | 0 |
| Tas | 3 | 2 | 1 |
| NT | 1 | 1 | 0 |
| ACT | 1 | 2 | 0 |
| Country of birth | |||
| Australia | 69 | 76 | 7 |
| Overseas | 31 | 24 | 7 |
-
*
Values represent the mean of 100 simulations.
Table 3
Modelled estimates of working years lost between 2003 and 2030 due to all cause premature mortality in 2003.
| FTE working years lost by SEIFA quintile | ||||||
|---|---|---|---|---|---|---|
| Q1 | Q2 | Q3 | Q4 | Q5 | TOTAL | |
| Male 95% CI % of total male | ||||||
| 47,690 | 47,622 | 45,358 | 39,591 | 32,542 | 212,802 | |
| 46,713–48,816 | 46,759–48,630 | 44,287–46,288 | 38,771–40,456 | 31,620–33,379 | 210,693–214,826 | |
| 22% | 22% | 21% | 19% | 15% | 100% | |
| Female 95% CI % of total female | ||||||
| 14,199 | 14,947 | 14,221 | 12,732 | 11,408 | 67,506 | |
| 13,627–14,924 | 14,446–15,565 | 13,697–14,860 | 12,269–13,318 | 10,914–11,872 | 66,542–68,599 | |
| 21% | 22% | 21% | 19% | 17% | 100% | |
| Total 95% CI % of total cohort | ||||||
| 61,888 | 62,569 | 59,579 | 52,323 | 43,949 | 280,308 | |
| 60,577–63,294 | 61,452–63,686 | 58,186–60,858 | 51,468–53,307 | 42,906–44,897 | 278,151–282,547 | |
| 22% | 22% | 21% | 19% | 16% | 100% | |
Download links
A two-part list of links to download the article, or parts of the article, in various formats.