Comparing two methods of reweighting a survey file to small area data
- Institute for Governance and Policy Analysis, University of Canberra, Australia
- University of Liverpool, United Kingdom
- Article
- Figures and data
- Jump to
Figures

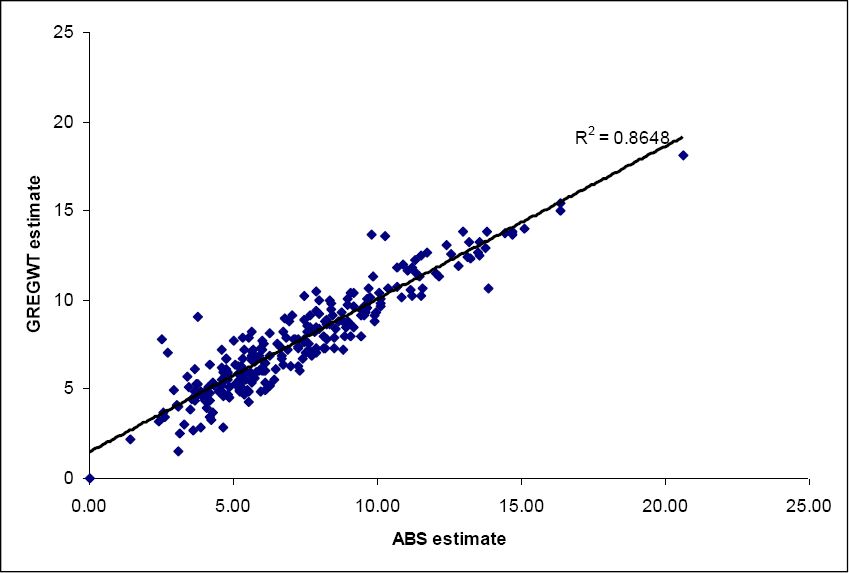
SLA level housing stress estimates (%).
Note: GREGWT (GREGWT convergent SLAs).

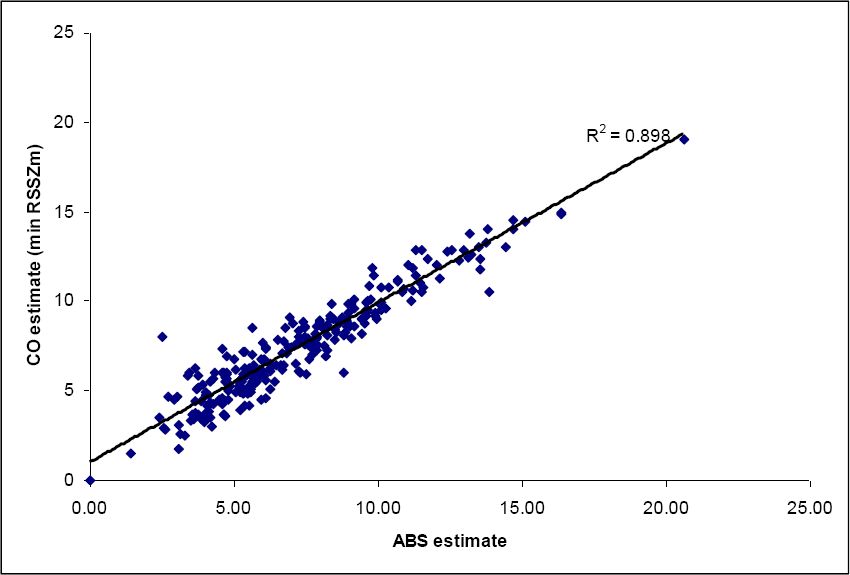
SLA level housing stress estimates (%).
Note: CO-Min Proportion (GREGWT convergent SLAs).

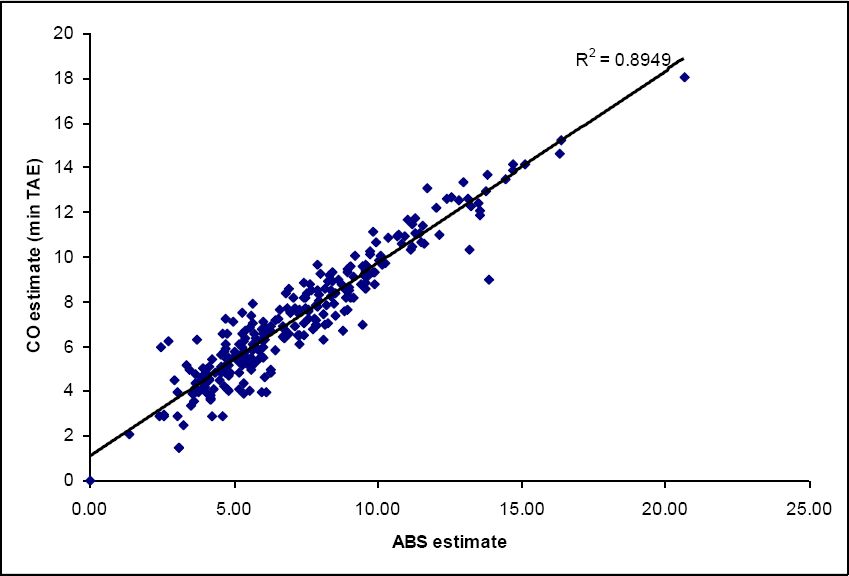
SLA level housing stress estimates (%): CO-Min Absolute.
Note: (GREGWT convergent SLAs).

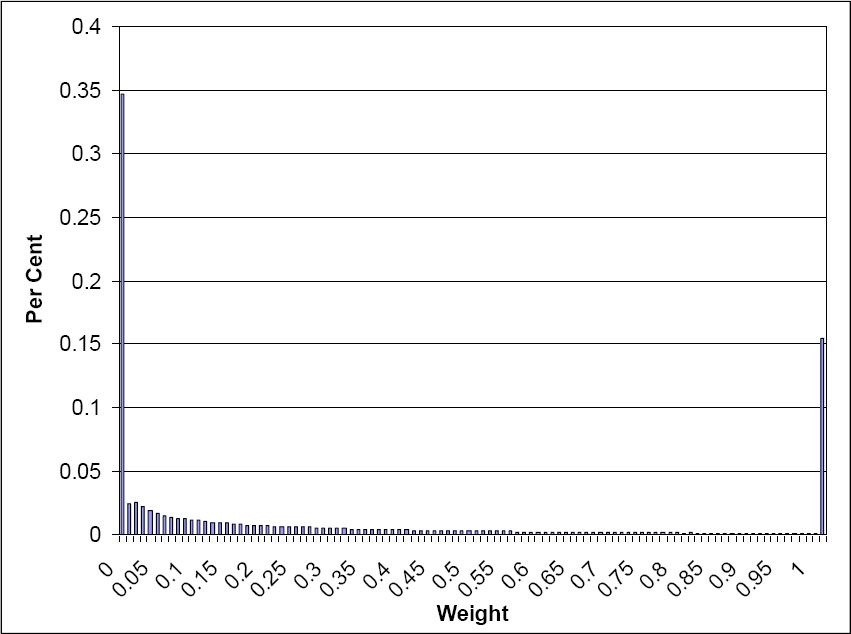
Distribution of GREGWT weights for NSW.
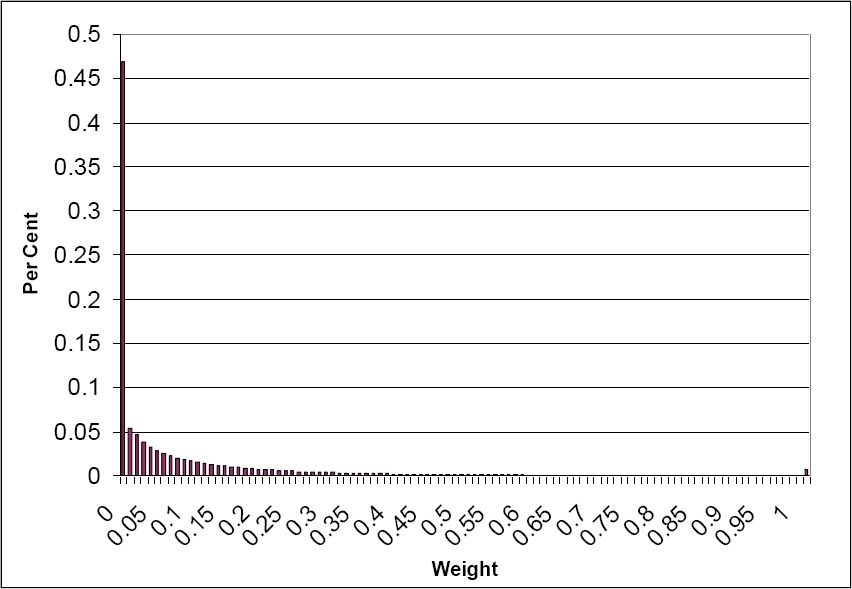

Distribution of GREGWT weights for the Australian Capital Territory.
Tables
Benchmarks used for creating small-area weights.
| Census table | Type | Dimensiona | Fully specifiedb | Benchmarks (no.) |
|---|---|---|---|---|
| Age by sex by labour force status | Person | Multi | Yes | 32 |
| Residents in different types of non-private dwelling | Person | Single | Yes | 8 |
| Household Type | Household | Single | No | 1 |
| Household size – number usual residents | Household | Single | Yes | 7 |
| Dwelling tenure by weekly household rent | Household | Multi | No | 7 |
| Dwelling tenure by household type | Household | Multi | Yes | 15 |
| Dwelling tenure by weekly household income | Household | Multi | No | 16 |
| Monthly household mortgage by weekly household income | Household | Multi | Yes | 12 |
| Weekly household rental by weekly household income | Household | Multi | Yes | 20 |
| Dwelling structure by household family composition | Household | Multi | No | 12 |
| Total number of benchmark tabulations | 10 | |||
| Total number of benchmarks | 130 | |||
-
a
Multi-dimensional means cross-tabulations of variables.
-
b
Not fully specified means that one or more of the cells in a benchmark tabulation were not used for weight production. For example, for the benchmark table of ‘Household Type’, the count of ‘Private households’ was extracted for use as a benchmark, whilst the count of ‘Non-private dwellings’ was excluded from the reweighting process.
Comparison of methods in summary.
| GREGWT | CO | |
|---|---|---|
| Approach | National household weights from a national survey dataset are reweighted to household weights for SLAs by constraining to small-area census counts | Selection of a combination of households from a national survey microdata set that best fit small-area census counts |
| Weights | In fractional numbers | In integer numbers |
| Preparation of census data | Needs to address re-allocation of ‘not-stated’ and ‘not applicable’ counts | Needs to address re-allocation of ‘not-stated’ and ‘not applicable’ counts |
| Conflicting benchmark counts due to statistical disclosure measures | Causes non-convergence because no set of weights can be found that simultaneously satisfies all benchmarks | Seeks to minimise the difference between the final weights and the target benchmarks which typically results in weights that matchthe average of any discrepant benchmarks |
| Optimisation strategy | Algorithm reaches an optimised solution when residual (i.e. difference between an synthetic estimate and the benchmark count) approaches zero | Minimise absolute or proportional error |
| ‘Convergent’ & ‘non-convergent’ SLAs | In some cases no convergent solution may be found; Average Household Absolute Sum of Residuals is >1 provides a proxy indicator for this non-convergence. | No convergence issues, although final ‘optimal’ estimates may still fail to fit all user-supplied benchmarks |
-
Source: NATSEM (GREGWT) and Williamson (CO).
Summary measures of goodness of fit.
| Measure | Description |
|---|---|
| Overall Total Absolute Error (OTAE) | Absolute Sum of Residuals summed across all benchmark counts |
| Overall Total Absolute Error per household (OTAE/HH) | Absolute sum of residuals per household across all benchmark counts |
| Overall Total Absolute Proportional Error (OTAPE) | Absolute difference between benchmark counts when expressed as fraction of the table total |
| Overall relative sum of Z-square scores (ORSumZ2) | For each benchmark table, the Z-score of each benchmark count squared, and summed for the table; then divide by chi-square critical value for table (--> RSumZ2), then sum across all tables (--> ORSumZ2). For a given table, RSumZ2 > 1 shows it is not fitting. |
Results for constrained variables, Australian Capital Territory.
(GREGWT ‘convergent’ SLAs only)
| Measure | GREGWT | CO (Min Proportion) | CO (Min Absolute) |
|---|---|---|---|
| OTAE | 139.6 | 133.4 | 92.2 |
| OTAE/HH | 0.1 | 0.1 | 0.1 |
| OTAPE | 0.4 | 0.2 | 0.2 |
| ORSumZ2 | 48.4 | 0.5 | 27.8 |
-
Note: Lower numbers signify greater accuracy.
Results for constrained variables, New South Wales.
(GREGWT ‘convergent’ SLAs only)
| Measure | GREGWT | CO (Min Proportion) | CO (Min Absolute) |
|---|---|---|---|
| OTAE | 602.9 | 483.1 | 979.3 |
| OTAE/HH | 0.1 | 0.1 | 0.1 |
| OTAPE | 0.2 | 0.1 | 0.2 |
| ORSumZ2 | 60.5 | 1.9 | 29.2 |
-
Note: Lower numbers signify greater accuracy.
Results for housing stress, Australian Capital Territory and New South Wales.
(GREGWT ‘convergent’ SLAs only)
| Number Unaffordable | ||||
|---|---|---|---|---|
| State | ABS | GREGWT | CO (Min Proportion) | CO (Min Absolute) |
| Australian Capital Territory | 5,526 | 6,147 | 5,924 | 5,821 |
| New South Wales | 169,823 | 194,394 | 191,720 | 189,269 |
| Total | 175,349 | 200,541 | 197,644 | 195,090 |
| % Unaffordable | ||||
| Australian Capital Territory | 5.9 | 5.9 | 5.7 | 5.6 |
| New South Wales | 9.1 | 9.2 | 9.1 | 8.9 |
| Combined | 9.0 | 9.0 | 8.9 | 8.8 |
Weights for GREGWT and CO.
Note: GREGWT convergent SLAs only.
| Maximum | Average non-zero value | |||
|---|---|---|---|---|
| Method | New South Wales | Australian Capital Territory | New South Wales Average | Australian Capital Territory Average |
| CO (Min Proportion) | 443 | 24 | 3.49 | 1.45 |
| GREGWT | 647 | 18 | 1.11 | 0.15 |