Cost-benefit model system of chronic diseases in Australia to assess and rank prevention and treatment options
- Australian National University, Australia
- University of Sydney, Australia
Cite this article
as: A. E Walker, S. Colagiuri; 2011; Cost-benefit model system of chronic diseases in Australia to assess and rank prevention and treatment options; International Journal of Microsimulation; 4(3); 57-70.
doi: 10.34196/ijm.00061
- Article
- Figures and data
- Jump to
Figures
Figure 1
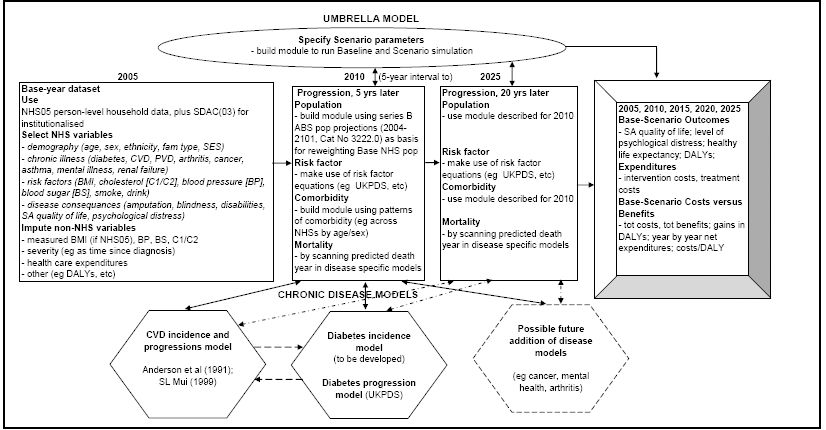
Chronic disease model-system.
Figure 2
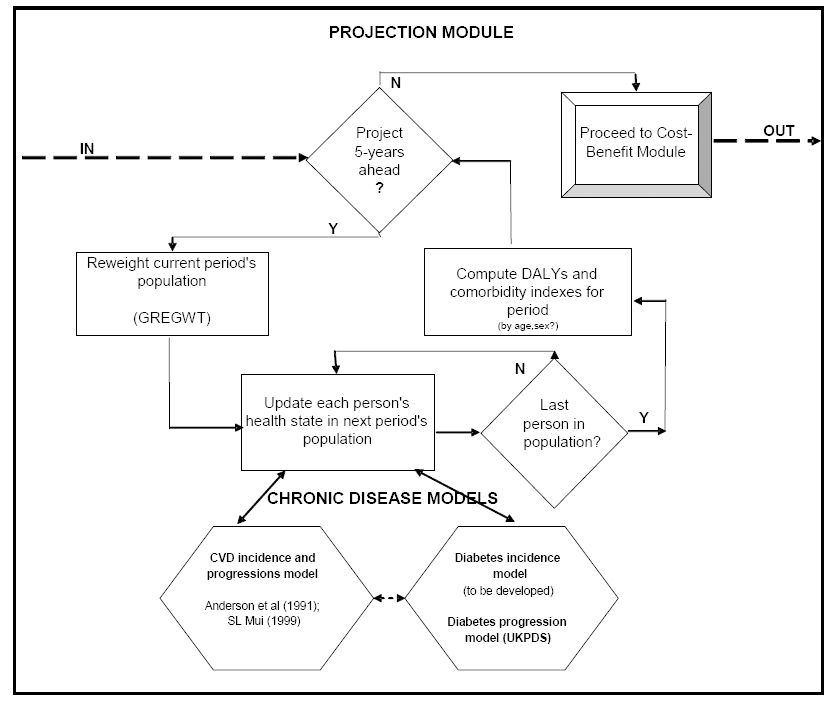

Umbrella model’s projection module.
Tables
Table 1
Coefficients of the Anderson CHD and stroke equation.
| Explanatory variables | CHD | CHD deaths | Stroke | CVD deaths |
|---|---|---|---|---|
| θ0 | 0.9145 | 2.9851 | −0.4312 | 0.8207 |
| θ1 | −0.2784 | −0.9142 | − | −0.4346 |
| β0 | 15.5305 | 11.2889 | 26.5116 | −5.0385 |
| female | 28.4441 | 0.2332 | 0.2019 | 0.2243 |
| log(age) | −1.4792 | −0.9440 | −2.3741 | 8.2370 |
| (log(age))2 | − | − | − | −1.2109 |
| log(age)* female | −14.4588 | − | − | − |
| (log(age))2 * female | 1.8515 | − | − | − |
| log (SBP) | −0.9119 | −0.5880 | −2.4643 | −0.8383 |
| cigarettes (Y/N) | −0.2767 | −0.1367 | −0.3914 | −0.1618 |
| log (total-C/HDL_C) | −0.7181 | −0.3448 | −0.0229 | −0.3493 |
| diabetes | −0.1759 | −0.0474 | −0.3087 | −0.0833 |
| diabetes * female | −0.1999 | −0.2233 | −0.2627 | −0.2067 |
| ECG-LVH | −0.5865 | −0.1237 | −0.2355 | −0.2946 |
-
Source: Anderson et al. (1991).
Download links
A two-part list of links to download the article, or parts of the article, in various formats.