Using statistics Canada LifePaths microsimulation model to project the disability status of Canadian elderly
- Université de Montréal, Canada
- Programme de démographie, Institut national de la recherche scientifique, INRS – Urbanisation Culture Société, Canada
Cite this article
as: J. Légaré, Y. Décarie; 2011; Using statistics Canada LifePaths microsimulation model to project the disability status of Canadian elderly; International Journal of Microsimulation; 4(3); 48-56.
doi: 10.34196/ijm.00060
- Article
- Figures and data
- Jump to
Figures
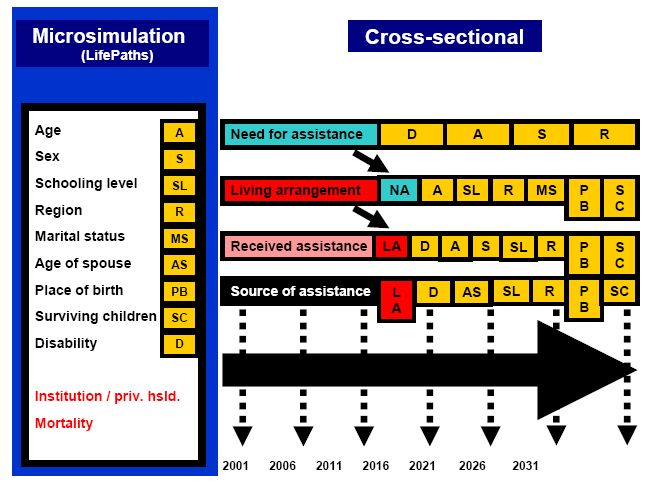
Figure 1

The projection model.
Figure 2

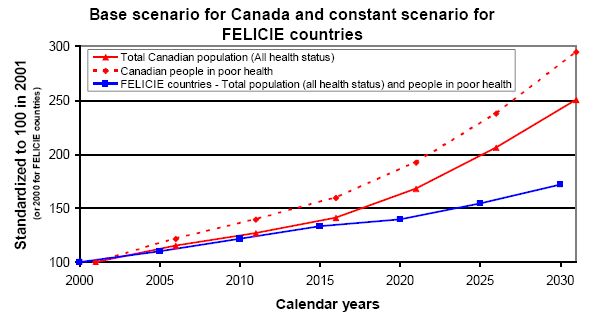
Trends in total population (all health status) and people in poor health, aged 75+, Canada and FELICIE countries.
Figure 3

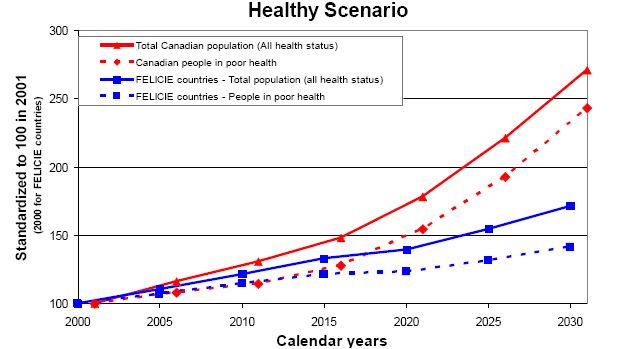
Trends in total population (all health status) and people in poor health, aged 75+, Canada and FELICIE countries.
Tables
Table 1
Trends in Canadian life expectancy and disability free life expectancy at birth with the base scenario.
| Year | Life expectancy (LE) | Disability free life expectancy (DFLE) | Life expectancy with disability (LEWD) |
|---|---|---|---|
| 2001 | 78.0 | 63.8 | 14.2 |
| 2011 | 79.7 | 64.6 | 15.1 |
| 2021 | 81.2 | 65.2 | 15.9 |
| 2031 | 82.4 | 65.7 | 16.7 |
-
Source: Results from LifePaths model.
Table 2
Trends in Canadian life expectancy and disability free life expectancy at age 45 with the base scenario.
| Year | Life expectancy (LE) | Disability free life expectancy (DFLE) | Life expectancy with disability (LEWD) |
|---|---|---|---|
| 2001 | 34.8 | 23.5 | 11.3 |
| 2011 | 36.1 | 24.0 | 12.1 |
| 2021 | 37.3 | 24.4 | 12.9 |
| 2031 | 38.3 | 24.7 | 13.7 |
-
Source: Results from LifePaths model.
Table 3
Canadian people aged 75+ in poor health*, according to two scenarios, 2001 to 2031.
| Year | MEN | WOMEN | |||
|---|---|---|---|---|---|
| Base scenario | Healthy scenario | Base scenario | Healthy scenario | ||
| n2001 | 196 019 | 192 900 | 307 787 | 302 924 | |
| Standardized to 100 in 2001 | 2001 | 100 | 100 | 100 | 100 |
| 2011 | 149 | 122 | 134 | 110 | |
| 2021 | 213 | 170 | 180 | 145 | |
| 2031 | 333 | 271 | 270 | 226 | |
-
Source: Results from LifePaths Model.
-
*
People in poor health are those moderately or severely disabled.
Table 4
Canadian people aged 75+ in poor health* without surviving children, according to two scenarios, 2001 to 2031.
| Year | MEN | WOMEN | |||
|---|---|---|---|---|---|
| Base scenario | Healthy scenario | Base scenario | Healthy scenario | ||
| n2001 | 49 606 | 48 768 | 59 125 | 58 421 | |
| Standardized to 100 in 2001 | 2001 | 100 | 100 | 100 | 100 |
| 2011 | 128 | 106 | 108 | 89 | |
| 2021 | 163 | 131 | 127 | 103 | |
| 2031 | 277 | 223 | 224 | 182 | |
-
Source: Results from LifePaths Model.
-
*
People in poor health are those moderately or severely disabled.
Table 5
Canadian people aged 75+ in poor health* not married* and without surviving children, according to two scenarios, 2001 to 2031.
| Year | MEN | WOMEN | |||
|---|---|---|---|---|---|
| Base scenario | Healthy scenario | Base scenario | Healthy scenario | ||
| n2001 | 29 590 | 29 063 | 49 744 | 49 131 | |
| Standardized to 100 in 2001 | 2001 | 100 | 100 | 100 | 100 |
| 2011 | 137 | 113 | 106 | 87 | |
| 2021 | 178 | 142 | 120 | 96 | |
| 2031 | 323 | 255 | 204 | 161 | |
-
Source: Results from LifePaths model.
-
*
People in poor health are those moderately or severely disabled.
-
**
Married people include people in Common Law Union.
Download links
A two-part list of links to download the article, or parts of the article, in various formats.