Developing a static microsimulation model for the analysis of housing taxation in Italy
- University of Torino, Italy
- Article
- Figures and data
- Jump to
Figures
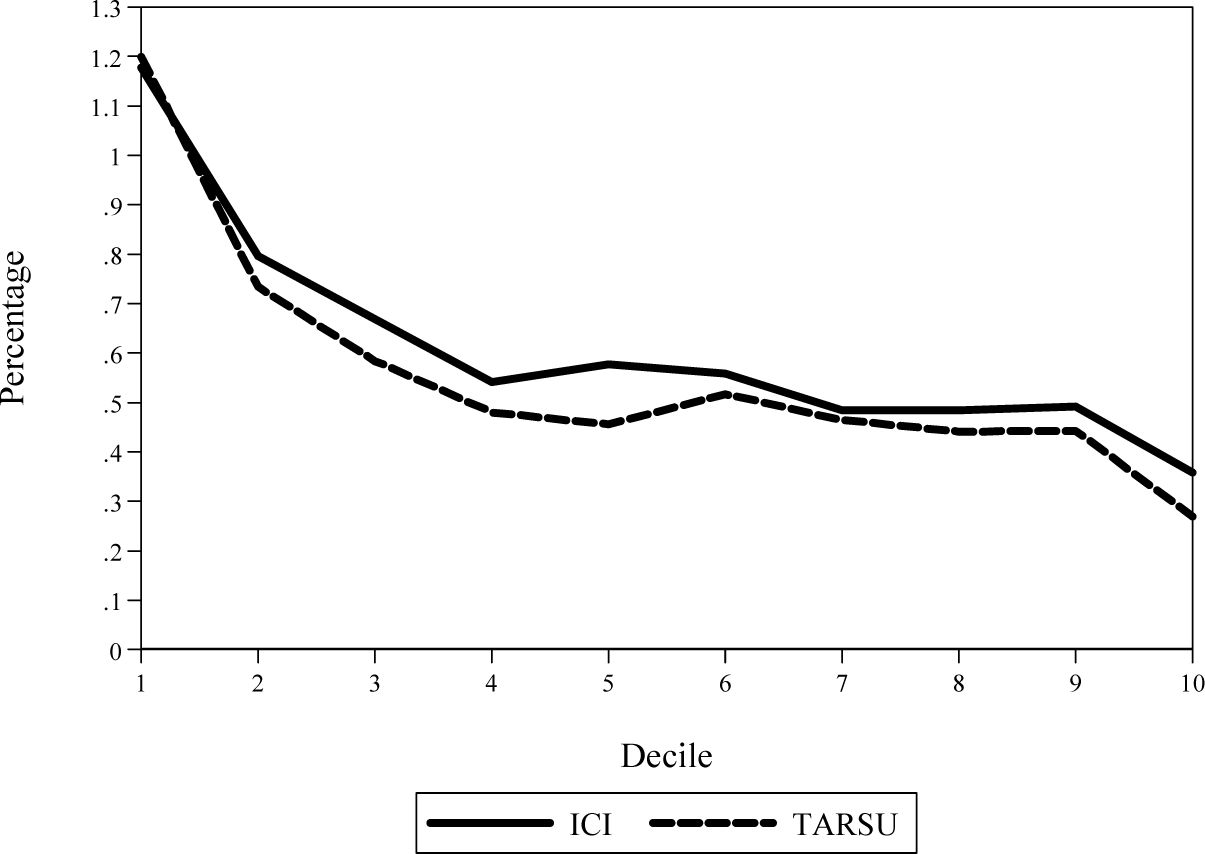
Incidence of ICI and TARSU on main residences.
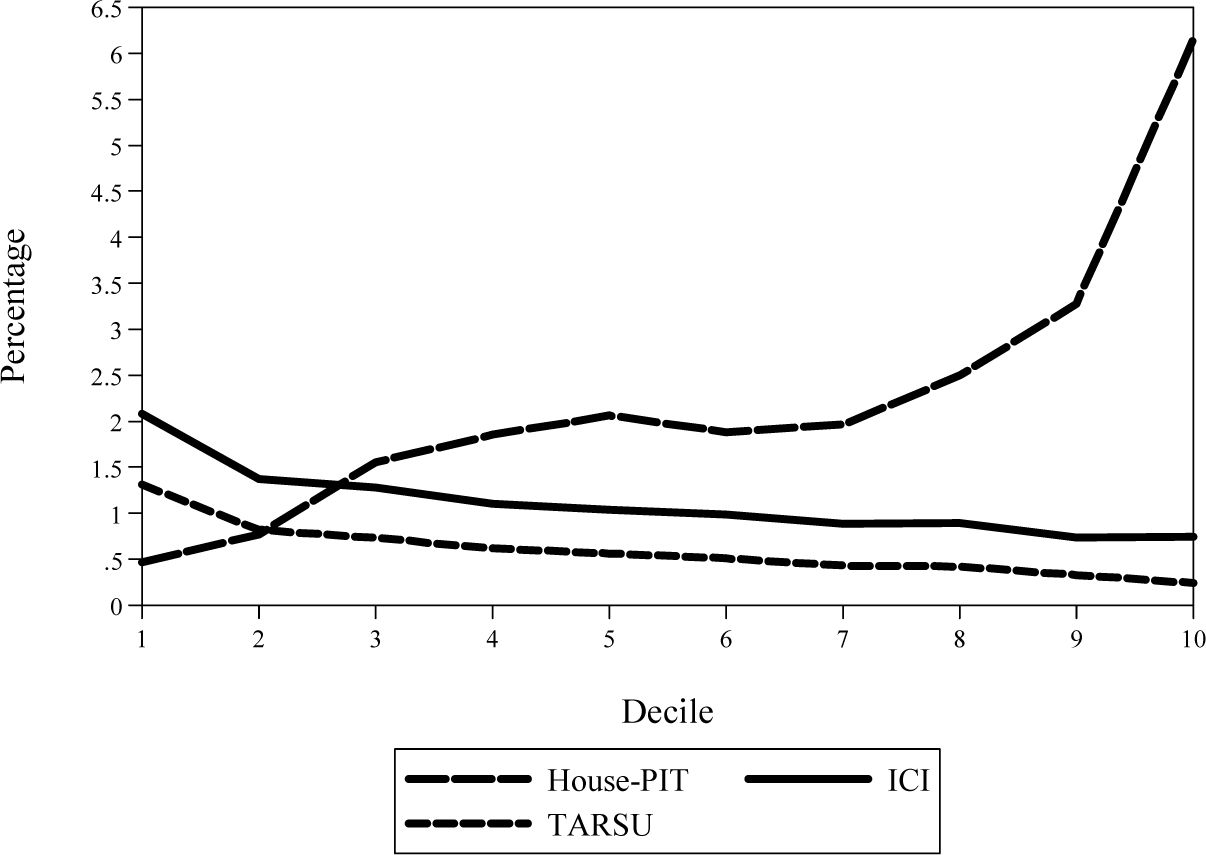
Incidence of House-PIT, ICI and TARSU on dwellings other than the main residence.
Tables
Households main residences composition by tenure status.
| Tenure Status | Composition (%) |
|---|---|
| Owner occupiers (with or without mortgage) | 68.7 |
| Life-tenants | 3.1 |
| Tenants or occupiers under redemption agreement | 21.3 |
| Rent-free tenants | 7.0 |
| Total | 100.0 |
-
Note: The total number of households is 2,34,81,999.
-
Source: Own calculations based on SHIW-BI.
Composition of second homes owned by households by type of utilization.
| Type of utilization | Composition (%) |
|---|---|
| Life-tenants households | 6.8 |
| Free-rented to households | 14.9 |
| Rented to households | 35.0 |
| Unoccupied dwellings or holiday homes | 43.3 |
| Total | 100.0 |
-
Note: The total number of dwellings is 1,00,52,261.
-
Source: Own calculations based on SHIW-BI.
Composition of PIT taxpayers and mean gross income by work status.
| Year 2006 | Number of taxpayers | Mean gross income (euro) | ||||
|---|---|---|---|---|---|---|
| Work status | Microsimulation model (A) | Ministry of Finance official statistics (B) | (A)/(B) | Microsimulation model (C) | Ministry of Finance official statistics (D) | (C)/(D) |
| Employee | 1,97,90,570 | 1,98,98,390 | 99.5 | 21,121 | 21,229 | 99.5 |
| Pensioner | 1,52,82,140 | 1,53,29,420 | 99.7 | 15,717 | 16,103 | 97.6 |
| Self employed | 41,65,622 | 39,89,143(a) | 104.4 | 18,768 | 18,697(b) | 100.4 |
| Other taxpayer | 22,55,637 | 12,41,749(c) | 181.6 | 2,063 | - | - |
| Total | 4,14,93,969 | 4,04,58,702 | 102.6 | 17,858 | 18,324 | 97.5 |
-
(a)
The statistic considers taxpayers with VAT code.
-
(b)
The number of these taxpayers has been evaluated as difference.
-
(c)
The mean value has been obtained considering taxpayers with positive and negative incomes.
-
Source: Own calculations based on SHIW-BI and Ministry of Finance 2008.
Gross income distribution by income classes (all taxpayers).
| Year 2006 | Microsimulation model | Ministry of Finance official statistics | ||
|---|---|---|---|---|
| Income class (euro) | Composition (%) | Mean (euro) | Composition (%) | Mean (euro) |
| 0–1.000 | 6.8 | 344 | 5.0 | 453 |
| 1.000–3.000 | 3.7 | 2,000 | 5.1 | 1,934 |
| 3.000–5.000 | 3.7 | 4,065 | 4.1 | 3,998 |
| 5.000–7.500 | 11.7 | 6,243 | 12.2 | 6,093 |
| 7.500–10.000 | 6.9 | 9,037 | 8.3 | 12,365 |
| 10.000–15.000 | 17.9 | 12,543 | 16.6 | 12,586 |
| 15.000–20.000 | 20.6 | 17,363 | 16.9 | 17,409 |
| 20.000–25.000 | 11.2 | 22,466 | 11.7 | 22,316 |
| 25.000–29.000 | 5.8 | 27,047 | 6.2 | 26,862 |
| 29.000–40.000 | 5.8 | 34,201 | 7.4 | 33,355 |
| 40.000–50.000 | 2.1 | 44,076 | 2.3 | 44,373 |
| 50.000–70.000 | 2.2 | 58,374 | 2.0 | 58,554 |
| 70.000–100.000 | 1.1 | 82,539 | 1.2 | 82,242 |
| 100.000–150.000 | 0.4 | 123,343 | 0.5 | 119,149 |
| oltre 150.000 | 0.3 | 298,685 | 0.3 | 284,662 |
| Total | 100.0 | 17,858 | 100.0 | 18,324 |
-
Note: The total number of taxpayers is 41,493,969.
-
Source: Own calculations based on SHIW-BI and Ministry of Finance 2008.
Distribution of the main residence cadastral income considering PIT taxpayers.
| Income class (euro) | Compo-sition (%) | Mean (euro) |
|---|---|---|
| 0–1.000 | 9.7 | 219 |
| 1.000–3.000 | 3.9 | 299 |
| 3.000–5.000 | 3.0 | 252 |
| 5.000–7.500 | 10.2 | 266 |
| 7.500–10.000 | 6.3 | 345 |
| 10.000–15.000 | 16.0 | 322 |
| 15.000–20.000 | 19.0 | 354 |
| 20.000–25.000 | 11.6 | 403 |
| 25.000–29.000 | 6.4 | 432 |
| 29.000–40.000 | 6.6 | 463 |
| 40.000–50.000 | 2.3 | 590 |
| 50.000–70.000 | 2.8 | 646 |
| 70.000–100.000 | 1.5 | 744 |
| 100.000–150.000 | 0.4 | 920 |
| Above 150.000 | 0.4 | 1,010 |
| Total | 100.0 | 363 |
-
Note: The total number of taxpayers is 24,319,766.
-
Source: Own calculations based on SHIW-BI.
Distribution of overall income from dwellings considering PIT taxpayers.
| Income class (euro) | Compo-sition (%) | Mean (euro) |
|---|---|---|
| 0–1.000 | 9.8 | 276 |
| 1.000–3.000 | 4.1 | 586 |
| 3.000–5.000 | 2.9 | 708 |
| 5.000–7.500 | 10.0 | 541 |
| 7.500–10.000 | 6.2 | 784 |
| 10.000–15.000 | 15.6 | 724 |
| 15.000–20.000 | 18.5 | 784 |
| 20.000–25.000 | 11.7 | 1,305 |
| 25.000–29.000 | 6.5 | 1,702 |
| 29.000–40.000 | 6.8 | 2,645 |
| 40.000–50.000 | 2.5 | 3,745 |
| 50.000–70.000 | 2.9 | 6,031 |
| 70.000–100.000 | 1.5 | 10,816 |
| 100.000–150.000 | 0.5 | 21,733 |
| Above 150.000 | 0.4 | 10,315 |
| Total | 100.0 | 1,455 |
-
Note: The total number of taxpayers is 2,64,46,945.
Source: Own calculations based on SHIW-BI.
Distribution of Households by tenure status and decile of equivalent net income.
| Tenure status | |||||
|---|---|---|---|---|---|
| Decile | Owner occupiers without mortgage or life-tenants | Owner occupiers with mortgage | Tenants or occupiers under redemption agreement | Rent-free tenants | Total |
| 1 | 59.1 | 5.3 | 26.7 | 8.9 | 100.0 |
| 2 | 59.6 | 4.1 | 27.2 | 9.1 | 100.0 |
| 3 | 59.3 | 7.1 | 24.0 | 9.7 | 100.0 |
| 4 | 62.1 | 7.1 | 22.2 | 8.6 | 100.0 |
| 5 | 60.3 | 7.6 | 25.4 | 6.7 | 100.0 |
| 6 | 65.9 | 9.1 | 19.4 | 5.6 | 100.0 |
| 7 | 64.1 | 9.1 | 20.8 | 6.0 | 100.0 |
| 8 | 63.2 | 11.9 | 19.7 | 5.2 | 100.0 |
| 9 | 67.6 | 10.1 | 16.5 | 5.8 | 100.0 |
| 10 | 76.1 | 10.1 | 10.0 | 3.8 | 100.0 |
| Total | 63.6 | 8.1 | 21.3 | 7.0 | 100.0 |
-
Source: Own calculations based on SHIW-BI.
Percentage of households with positive main residence cadastral income and its mean value by decile of equivalent gross income.
| Decile | Households(%) | Mean value (euro) | Mean value / household income (%) |
|---|---|---|---|
| 1 | 64.4 | 366.4 | 5.0 |
| 2 | 63.7 | 362.0 | 2.9 |
| 3 | 66.4 | 367.3 | 2.3 |
| 4 | 69.2 | 406.4 | 2.3 |
| 5 | 67.9 | 494.3 | 2.5 |
| 6 | 74.9 | 483.8 | 2.0 |
| 7 | 73.2 | 508.6 | 1.8 |
| 8 | 75.1 | 570.4 | 1.8 |
| 9 | 77.7 | 668.0 | 1.7 |
| 10 | 86.2 | 903.9 | 1.3 |
| Total | 71.7 | 524.0 | 1.9 |
-
Source: Own calculations based on SHIW-BI.
Percentage of households with positive other housing income and its mean value by decile of equivalent gross income.
| Decile | Household (%) | Mean value (euro) | Mean value / household income (%) |
|---|---|---|---|
| 1 | 13.3 | 964.2 | 11.6 |
| 2 | 14.7 | 1,709.6 | 12.9 |
| 3 | 18.0 | 1,847.2 | 11.3 |
| 4 | 19.6 | 1,652.2 | 8.6 |
| 5 | 21.6 | 2,402.1 | 11.7 |
| 6 | 27.7 | 2,124.4 | 8.3 |
| 7 | 21.9 | 2,526.6 | 8.5 |
| 8 | 31.1 | 2,758.1 | 8.1 |
| 9 | 40.9 | 4,922.8 | 12.0 |
| 10 | 53.1 | 13,733.8 | 20.3 |
| Total | 26.0 | 4,862.8 | 14.1 |
-
Source: Own calculations based on SHIW-BI.
Kakwani index.
| Tax | Kakwani index |
|---|---|
| Overall tax-benefit system | 0.05261 |
| House-PIT | 0.00515 |
| ICI | 0.00002 |
| TARSU | -0.00090 |
-
Source: Own calculations based on SHIW-BI.
Tax cuts distribution of the 2008 housing taxation reform.
| Households with positive ICI (%) | |||||||
|---|---|---|---|---|---|---|---|
| 2006 | 2008 | ||||||
| Decile | Main residence | Other dwellings | Total | Main residence | Other dwellings | Total | Distribution of the tax cuts between 2006 and 2008 |
| 1 | 43.0 | 18.8 | 49.4 | 0.0 | 18.8 | 18.8 | 4.7 |
| 2 | 44.2 | 22.3 | 53.8 | 0.0 | 22.3 | 22.3 | 4.8 |
| 3 | 48.6 | 24.7 | 57.0 | 0.0 | 24.7 | 24.7 | 5.3 |
| 4 | 52.1 | 24.7 | 59.0 | 0.0 | 24.7 | 24.7 | 6.3 |
| 5 | 57.9 | 25.6 | 63.2 | 0.0 | 25.6 | 25.6 | 8.6 |
| 6 | 64.0 | 32.1 | 72.1 | 0.0 | 32.1 | 32.1 | 8.9 |
| 7 | 65.6 | 26.1 | 70.9 | 0.0 | 26.1 | 26.1 | 9.5 |
| 8 | 69.3 | 33.9 | 73.8 | 0.0 | 33.9 | 33.9 | 11.7 |
| 9 | 74.2 | 44.0 | 80.5 | 0.0 | 44.0 | 44.0 | 15.0 |
| 10 | 83.9 | 55.5 | 89.6 | 0.0 | 55.5 | 55.5 | 25.0 |
| Total | 59.9 | 30.6 | 66.6 | 0.0 | 30.6 | 30.6 | 100.0 |
-
Source: Own calculations based on SHIW-BI.