On the Italian ACE and its impact on enterprise performance: A PLS-path modeling analysis
- University of Cassino, Department of Economics, Italy
- ISTAT, Italy
Cite this article
as: S. Balzano, F. Oropallo, V. Parisi; 2011; On the Italian ACE and its impact on enterprise performance: A PLS-path modeling analysis; International Journal of Microsimulation; 4(2); 14-26.
doi: 10.34196/ijm.00050
- Article
- Figures and data
- Jump to
Figures
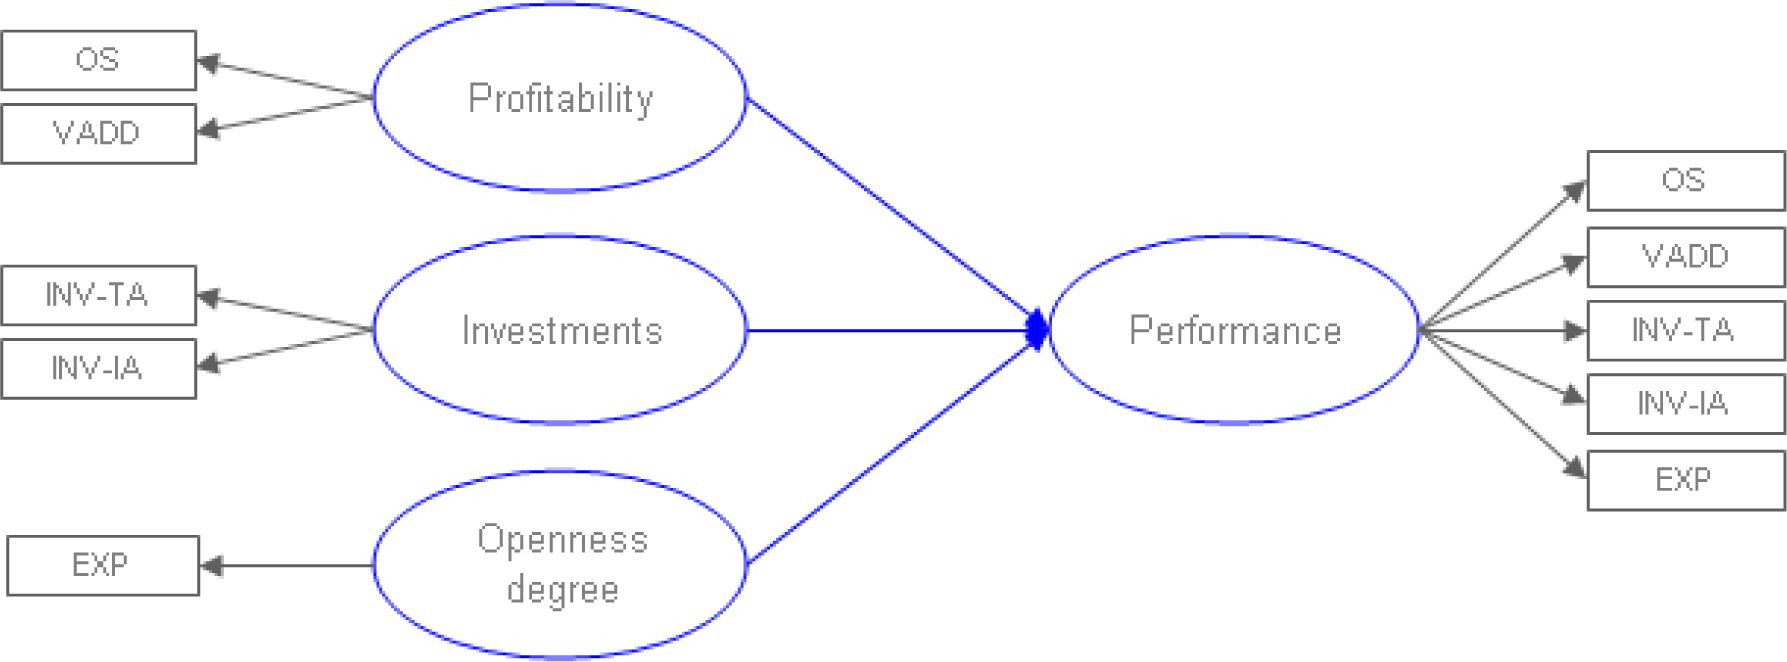
Figure 1
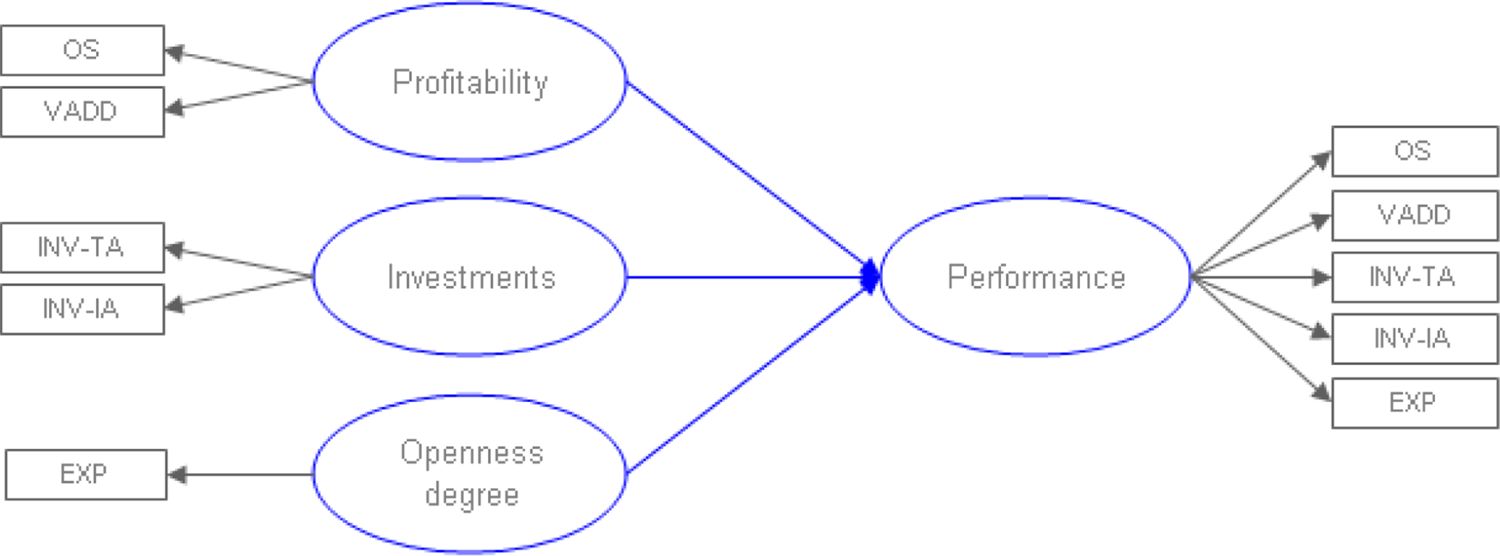
The causal model for performance estimation.
Legend: OS = Operating surplus, VADD = Value added, INV-TA = Investments (tangible assets), INV-IA = Investments (intangible assets), EXP = Turnover from exports
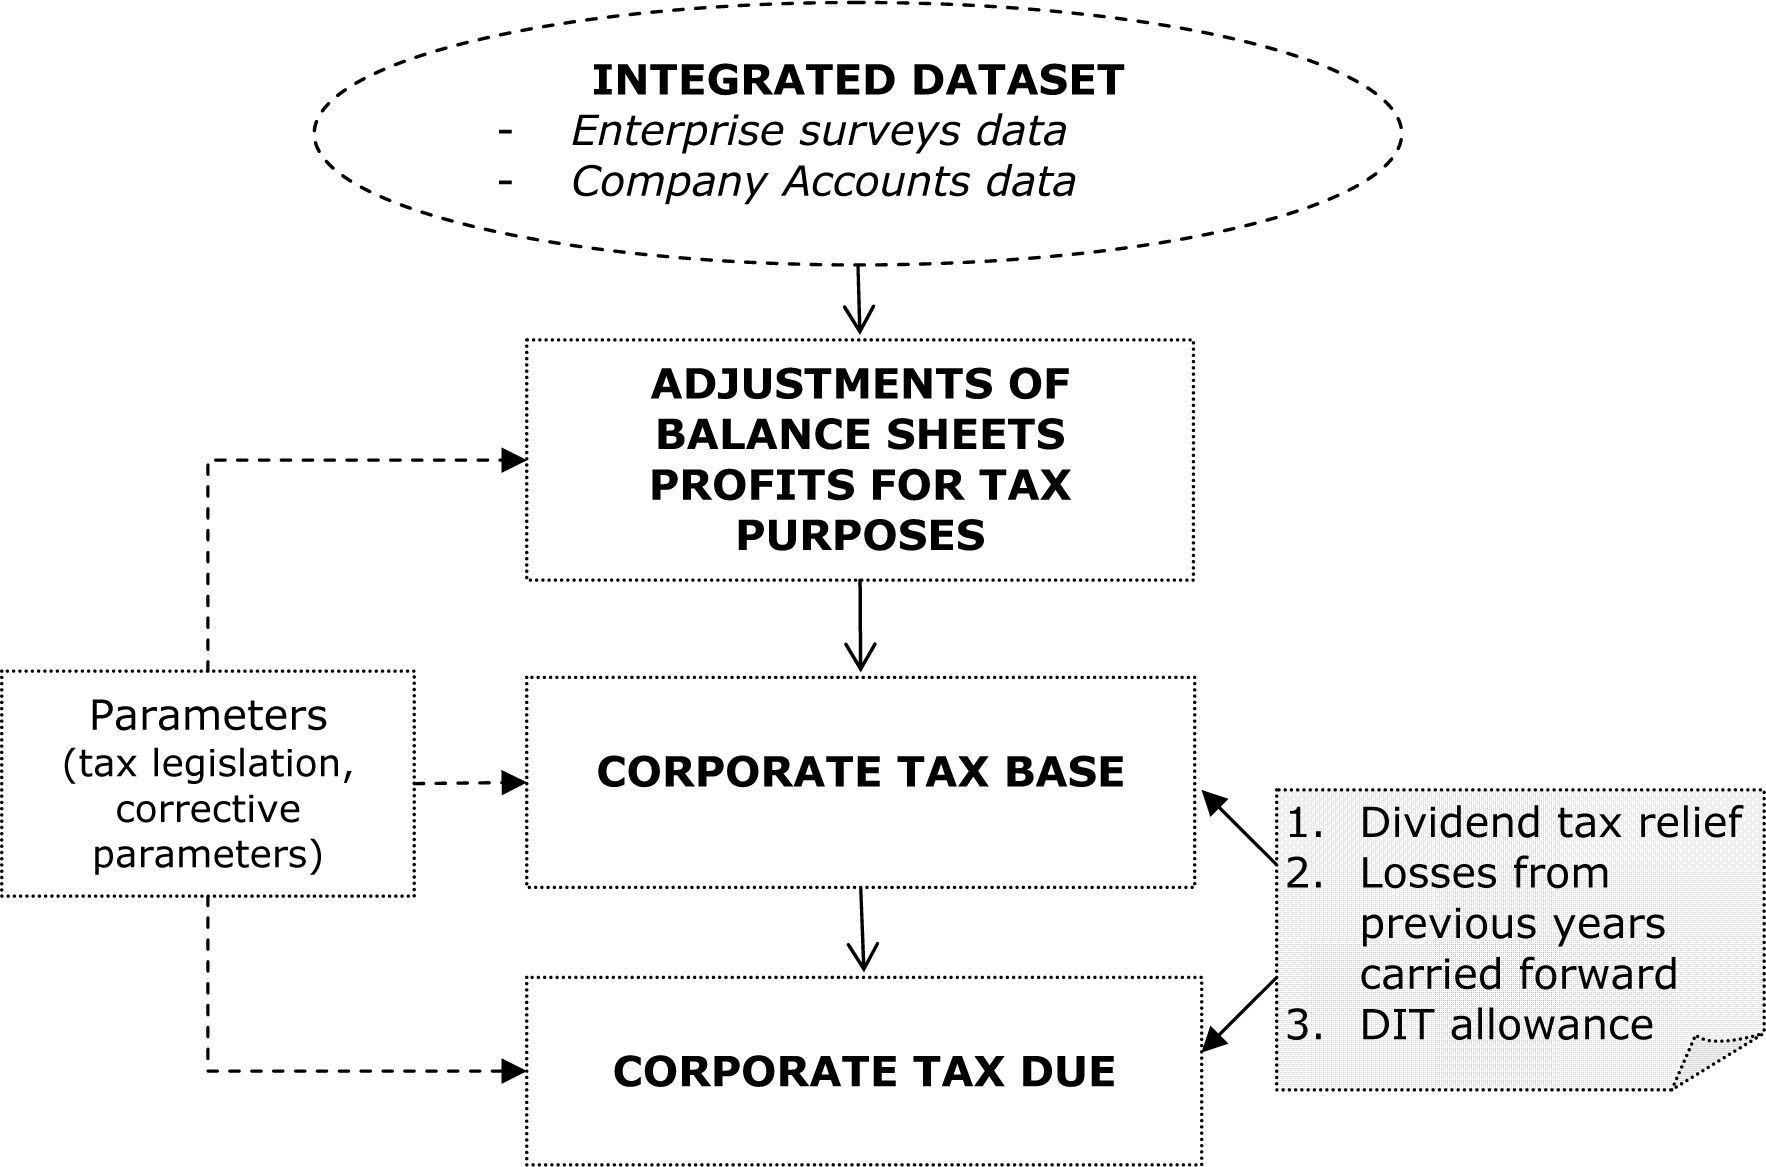
Figure 2
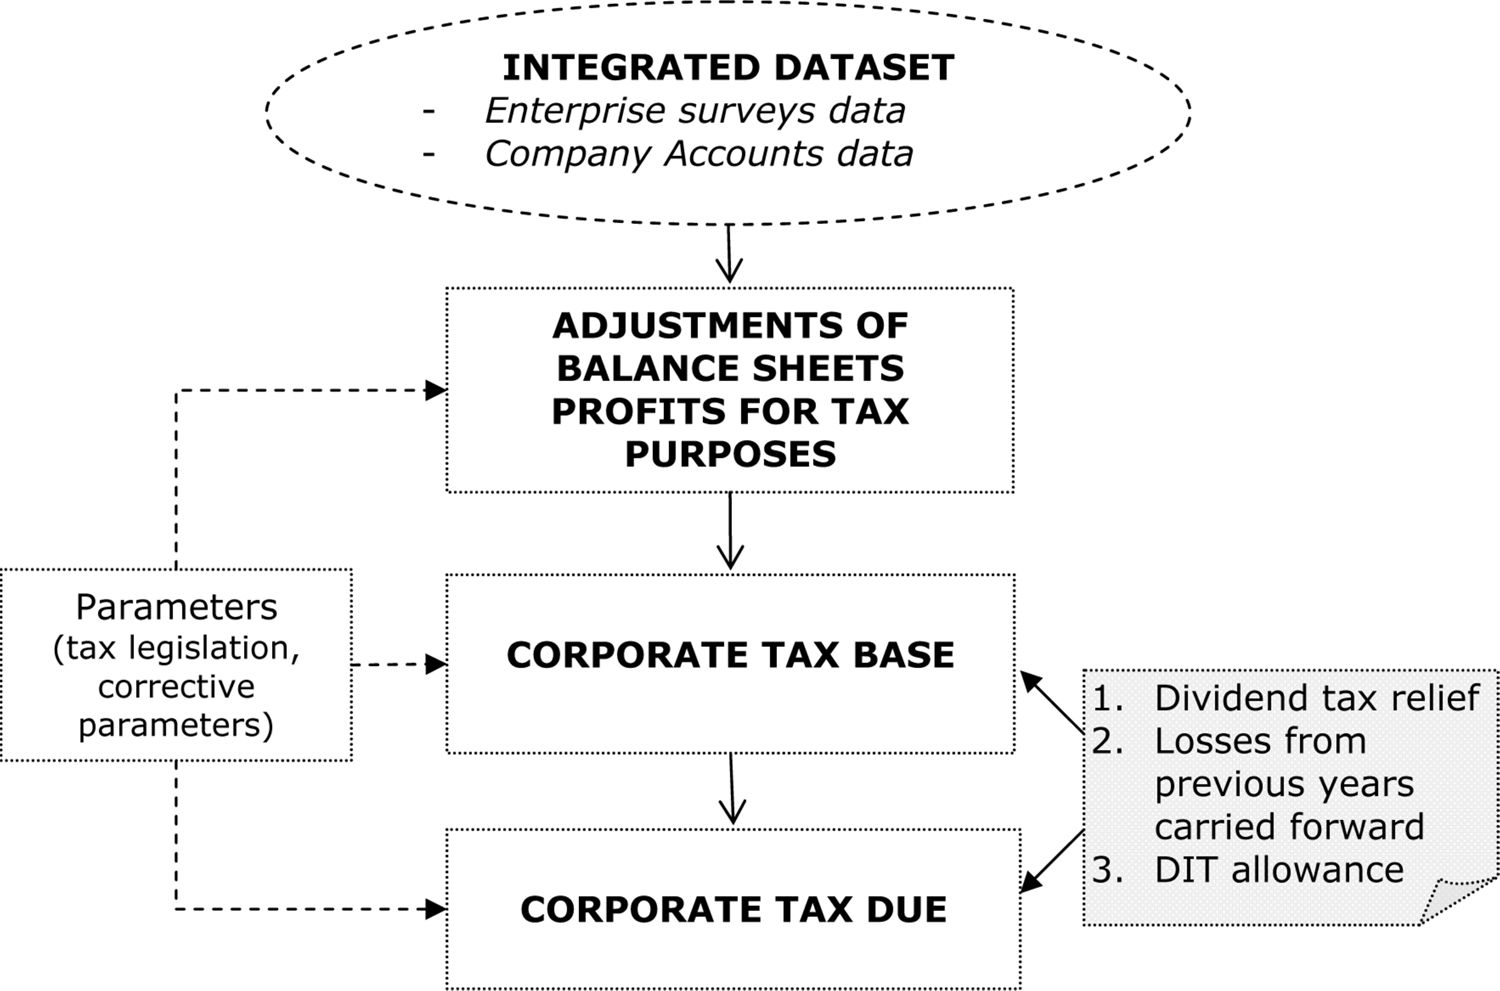
The structure of the corporate tax microsimulation model.
Figure 3
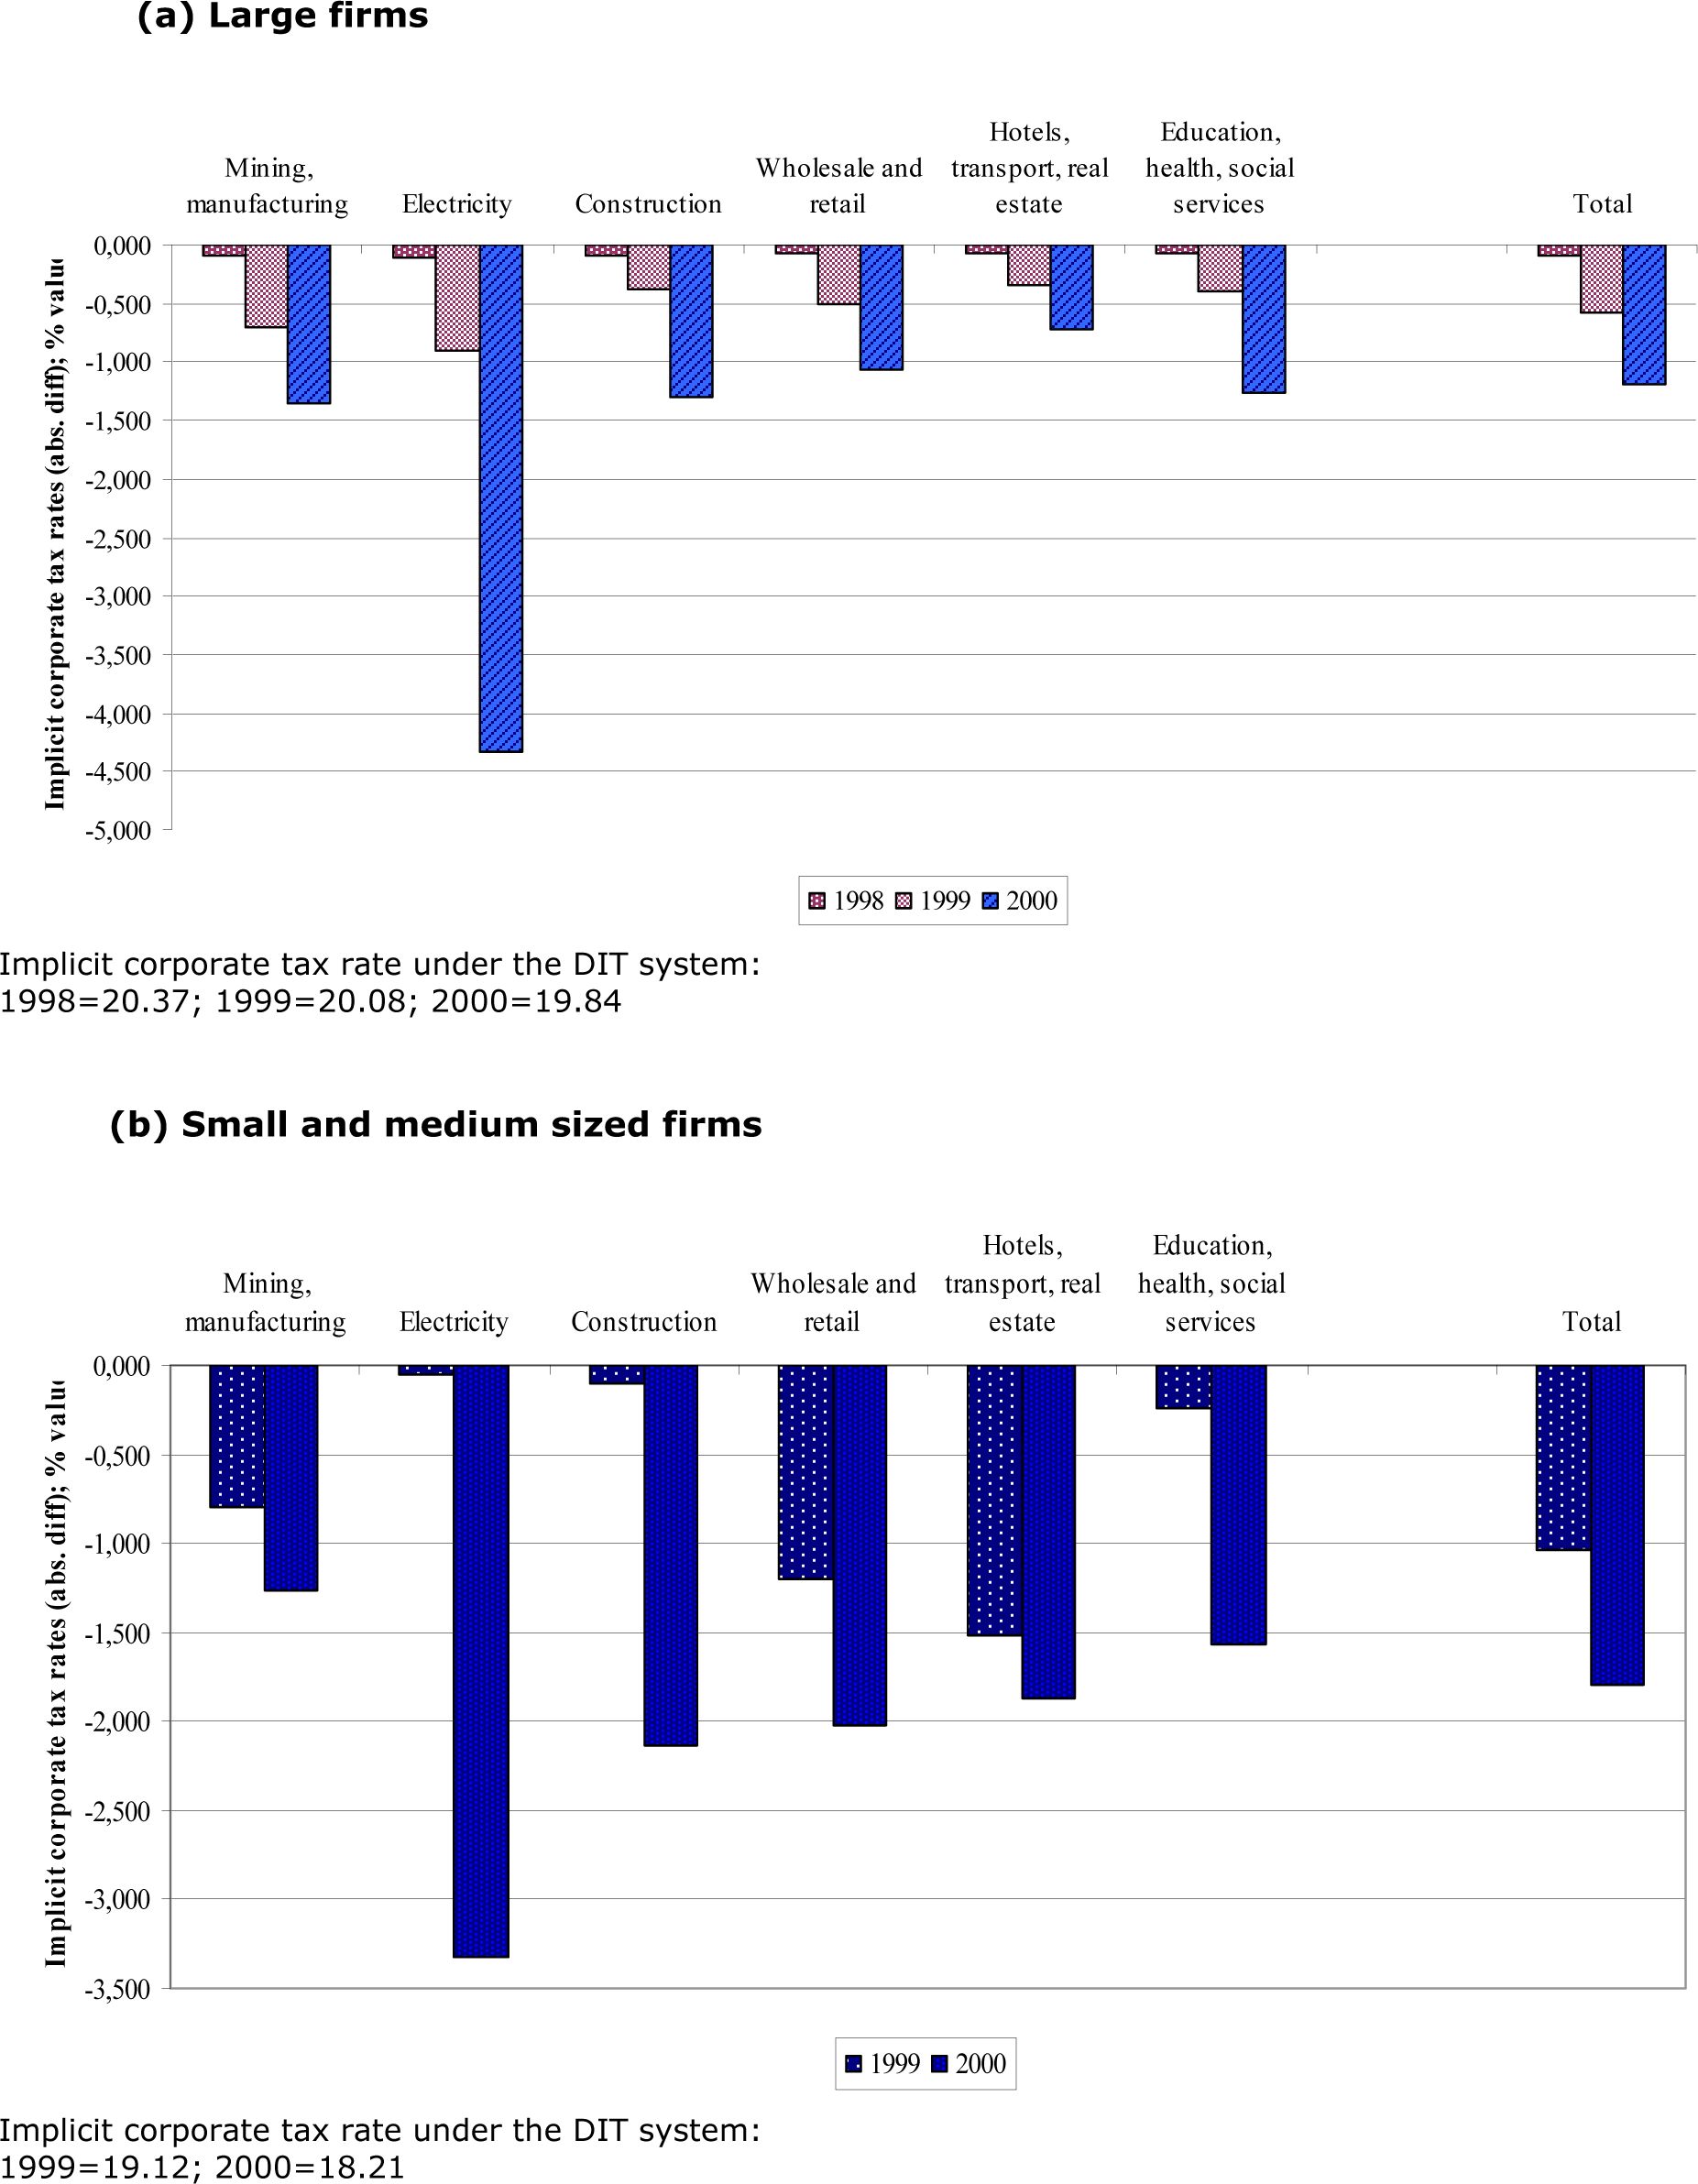

Changes in the implicit corporate tax rates due to the DIT system. Years 1998–2000.
Source: Authors’ computations
Figure 4
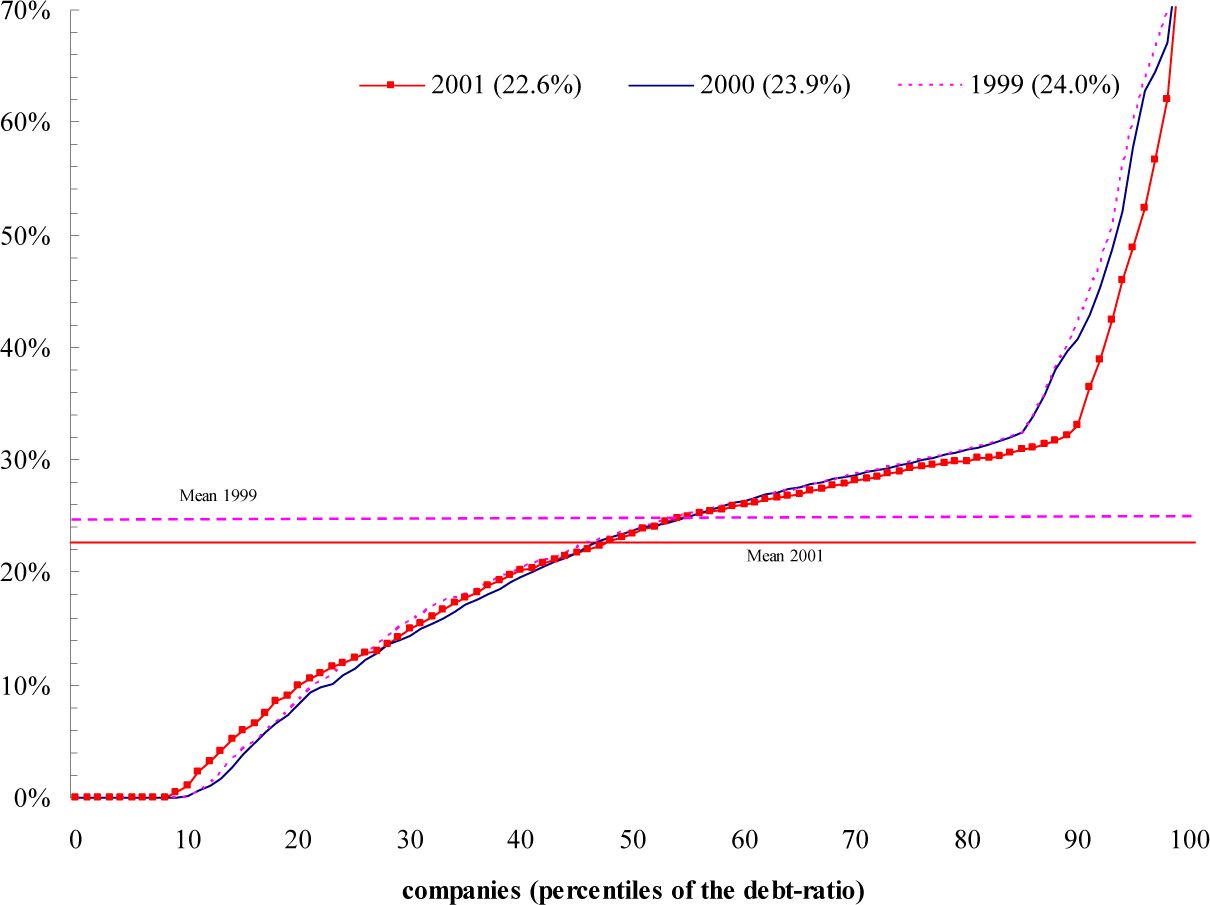

Debt-ratio (financial debts/net assets); years 1999–2001.
Source: authors’ computations on ISTAT data The average debt-ratio fell by 1.4 percentage points in the period 1999–2001, and this suggests a significant effect of the DIT mechanism on firms’ capitalisation3.
Tables
Table 1
Number of companies present in the database by business sector; years 1998–2001.
| 1998 | 1999 | 2000 | 2001 | ||||
|---|---|---|---|---|---|---|---|
| Business sector | LE | LE | SME | LE | SME | LE | SME |
| Mining, manufacturing | 4,779 | 4,763 | 5,566 | 4,456 | 7,196 | 4,967 | 9,648 |
| Electricity | 102 | 99 | 254 | 74 | 245 | 122 | 257 |
| Construction | 322 | 328 | 430 | 299 | 705 | 336 | 708 |
| Wholesale and retail | 703 | 744 | 2,704 | 711 | 3,243 | 923 | 3,606 |
| Hotels, transport, real estate | 1,814 | 1,997 | 3,737 | 1,907 | 5,208 | 2,313 | 5,105 |
| Education, health, social services | 557 | 578 | 1,352 | 562 | 1,590 | 709 | 1,770 |
| Total | 8,277 | 8,509 | 14,043 | 8,009 | 18,187 | 9,370 | 21,094 |
-
Source: ISTAT.
Legend: LE: Large Enterprise; SME: small and medium-sized enterprises.
Table 2
Simulated number of companies in the dataset eligible to the DIT allowance. Years 1998–2000.
| 1998 | 1999 | 2000 | ||||
|---|---|---|---|---|---|---|
| Number | % | Number | % | Number | % | |
| Large firms | 3,070 | 37 | 3,692 | 43 | 4,405 | 55 |
| Total | 8,277 | 100 | 8,509 | 100 | 8,009 | 100 |
| Small and medium sized firms | 4,217 | 30 | 9,772 | 54 | ||
| Total | 14,043 | 100 | 18,187 | 100 | ||
-
Source: Authors’ computations
Table 3
Regression analysis: average performance (years 1999, 2000, 2001) of companies not benefiting (DIT=0), benefiting (DIT=1) from DIT in the previous year. Large firms.
| 1999 | 2000 | 2001 | |||||||
|---|---|---|---|---|---|---|---|---|---|
| Value | t | Pr>| t | | Value | t | Pr>| t | | Value | T | Pr>| t | | |
| < | < | ||||||||
| Intercept | 0.000 | 474.755 | 0,0001 | 0.000 | 201.248 | 0,0001 | 0.000 | 167.450 | < 0,0001 |
| < | < | ||||||||
| DIT=0 | 8.083 | 376.577 | 0.0001 | 5.164 | 188.882 | 0.0001 | 3.235 | 57.039 | < 0.0001 |
| < | < | ||||||||
| DIT=1 | 8.147 | 474.755 | 0.0001 | 5.234 | 201.248 | 0.0001 | 3.183 | 167.450 | < 0.0001 |
Table 4
Regression analysis: average performance (years 2000, 2001) of companies not benefiting (DIT=0), benefiting (DIT=1) from DIT in the previous year. Small and medium sized firms.
| 2000 | 2001 | |||||
|---|---|---|---|---|---|---|
| Value | t | Pr>| t | | Value | T | Pr>| t | | |
| Intercept | 0.000 | 946.448 | < 0.0001 | 0.000 | 912.961 | < 0.0001 |
| DIT=0 | 8.356 | 634.464 | < 0.0001 | 8.468 | 351.932 | < 0.0001 |
| DIT=1 | 8.827 | 946.448 | < 0.0001 | 8.507 | 912.961 | < 0.0001 |
-
Source: Authors’ computations
Table A1
Weight of performance factors; 1998–2001.
| Large firms | Small and medium sized firms | |||||||
|---|---|---|---|---|---|---|---|---|
| 1998 | 1999 | 2000 | 2001 | 1999 | 2000 | 2001 | ||
| PERFORMANCE | Operating surplus | 0.831 | 0.823 | 0.829 | 0.847 | 0.750 | 0.742 | 0.884 |
| Value added | 0.936 | 0.901 | 0.882 | 0.879 | 0.825 | 0.781 | 0.895 | |
| Investments (tangible assets) | 0.936 | 0.961 | 0.902 | 0.881 | 0.381 | 0.339 | 0.325 | |
| Investments (intangible assets) | 0.213 | 0.716 | 0.574 | 0.473 | 0.385 | 0.341 | 0.326 | |
| Turnover from exports | 0.399 | 0.346 | 0.444 | 0.474 | 0.592 | 0.573 | 0.415 | |
-
Source: Authors’ computations.
Table A2
Enterprise performance (standardized values) by business sector, firm size; years 1999, 200, 2001.
| 1999 | 2000 | 2001 | N % (2001) | |
|---|---|---|---|---|
| Business sector | ||||
| Mining, manufacturing | 0.263 | 0.200 | −0.071 | 47.97 |
| Electricity | 0.229 | 0.242 | 2.076 | 1.24 |
| Construction | −0.114 | −0.082 | −0.651 | 3.43 |
| Wholesale and retail | −0.029 | −0.011 | 0,372 | 14.87 |
| Hotels, transport, real estate | −0.073 | −0.071 | −0.227 | 24.35 |
| Education, health, social services | −0.125 | −0.075 | 0,174 | 8,14 |
| Firm size (number of employees) | ||||
| 1-19 | −0.097 | −0.078 | 1.424 | 39.33 |
| 20-49 | 0.613 | 0.437 | 1.839 | 16.57 |
| 50-99 | 1.886 | 1.339 | 2.006 | 16.68 |
| 100-249 | 0.111 | 0.053 | −3.838 | 18.42 |
| 250-499 | −0.035 | −0.029 | −3.712 | 5.45 |
| 500-999 | 0.105 | 0.314 | −3.492 | 2,08 |
| more than 999 | 1.710 | 1.958 | −1.610 | 1.47 |
-
Source: Authors’ computations.
Download links
A two-part list of links to download the article, or parts of the article, in various formats.