Validating a dynamic population microsimulation model: Recent experience in Australia
- University of Canberra, Australia
Cite this article
as: A. Harding, M. Keegan, S. Kelly; 2010; Validating a dynamic population microsimulation model: Recent experience in Australia; International Journal of Microsimulation; 3(2); 46-64.
doi: 10.34196/ijm.00038
Figures
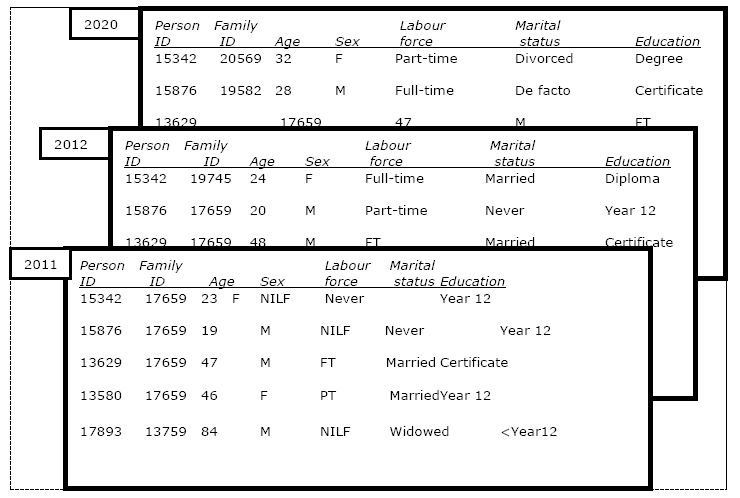
Figure 1

Output structure of a typical discrete time dynamic population microsimulation model.
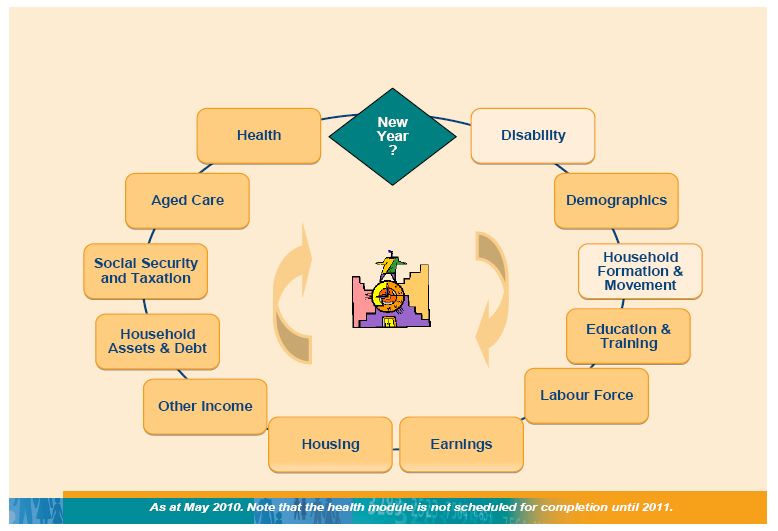
Figure 2

Outline of the processes simulated in APPSIM/2010A.
Figure 3
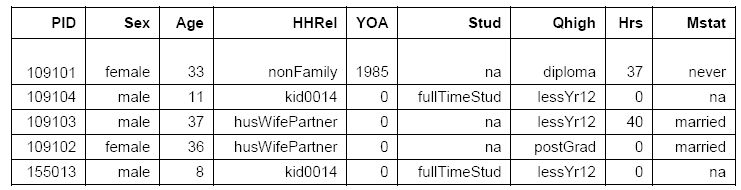
Extract from APPSIM ‘everyone output’ for Year t.
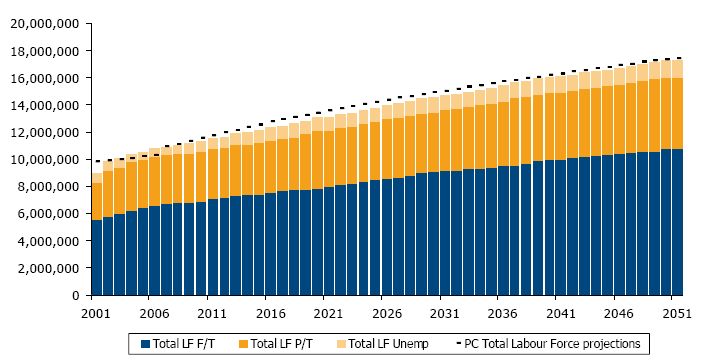
Figure 4

Sample labour force output from APPSIM’s automatically generated summary statistics report.
Note: the labour force output here is unaligned. The black dotted lines are labour force projections from a 2005 Productivity Commission report.
Figure 5
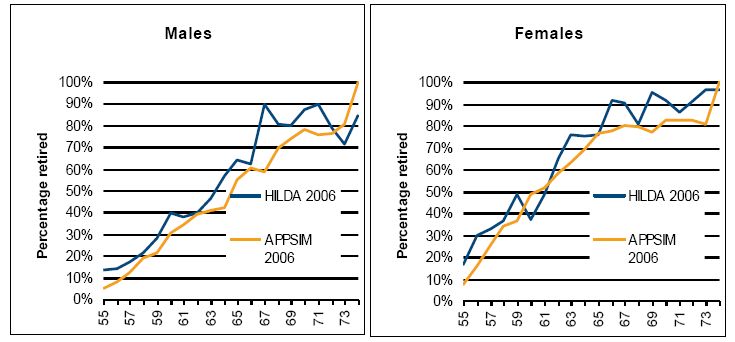

Percentage of people who are retired, age 55–74, APPSIM and HILDA 2006, by age and sex.
Source: APPSIM simulations, HILDA 2006.
Figure 6
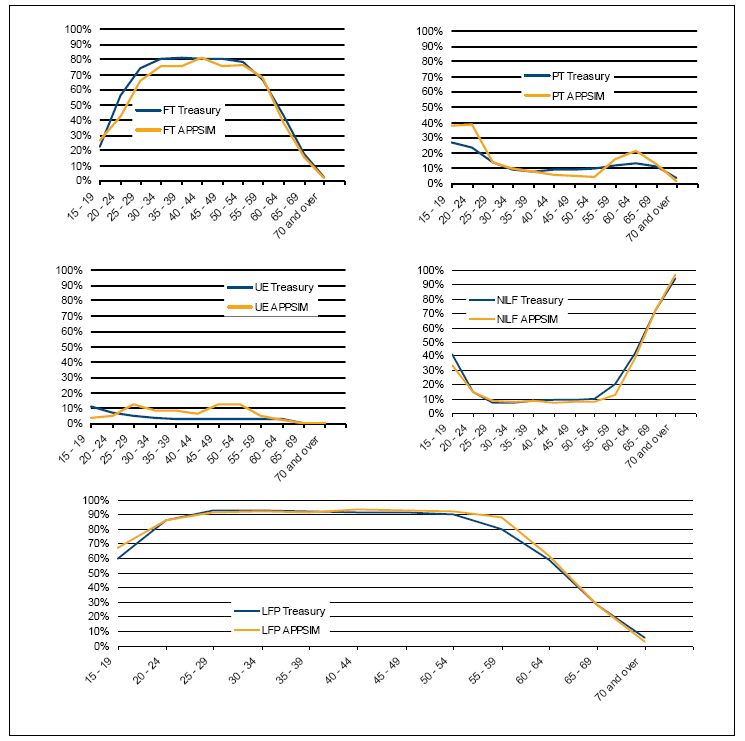

Labour force states of men in 2047, APPSIM and treasury projections.
Source: Treasury (2007) and APPSIM simulations.
Figure 7
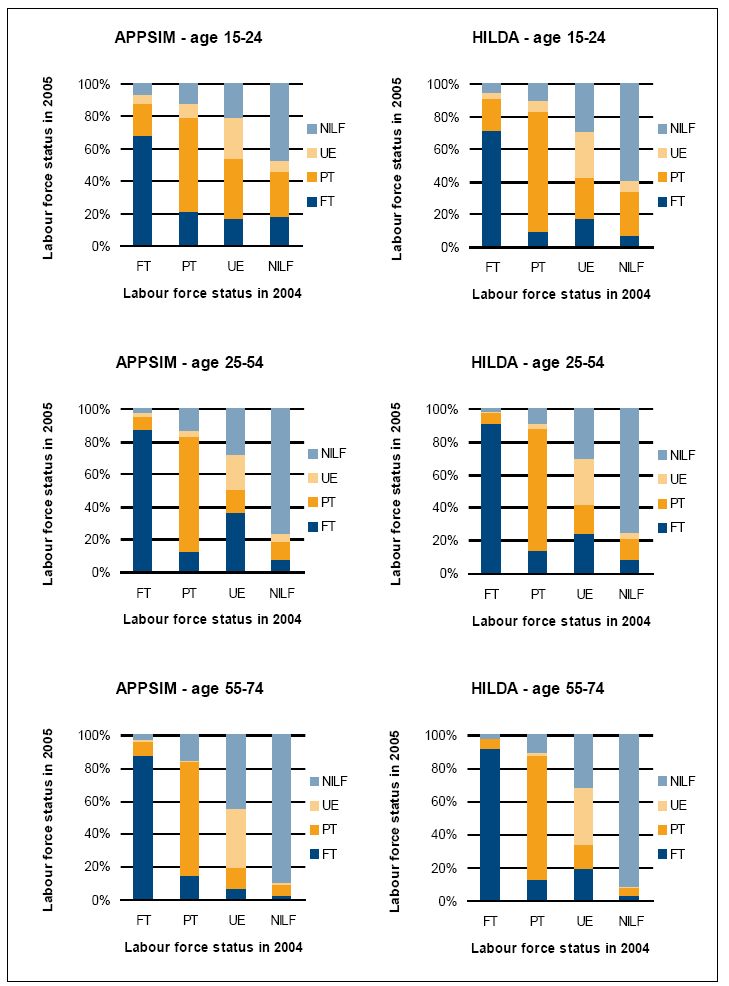

Labour force transitions in HILDA and APPSIM, 2004–2005.
Source: HILDA, APPSIM calculations.
Figure 8
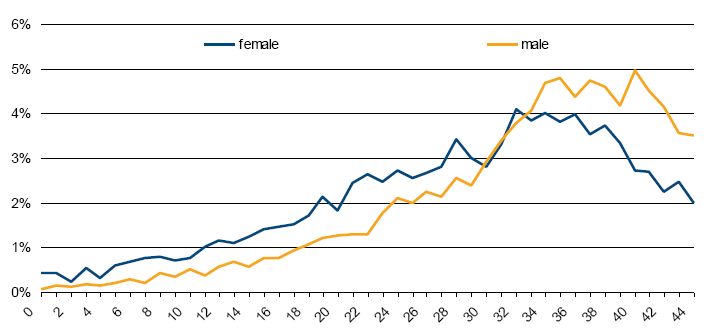

Distribution of years spent in labour force by sex, 65–70 year olds in 2051.
Source: APPSIM simulations.
Download links
A two-part list of links to download the article, or parts of the article, in various formats.