Alignment and matching in multi-purpose household microsimulations
- 284 Albert Road, Australia
Cite this article
as: J. Richard Cumpston; 2010; Alignment and matching in multi-purpose household microsimulations; International Journal of Microsimulation; 3(2); 34-45.
doi: 10.34196/ijm.00037
- Article
- Figures and data
- Jump to
Figures
Figure 1
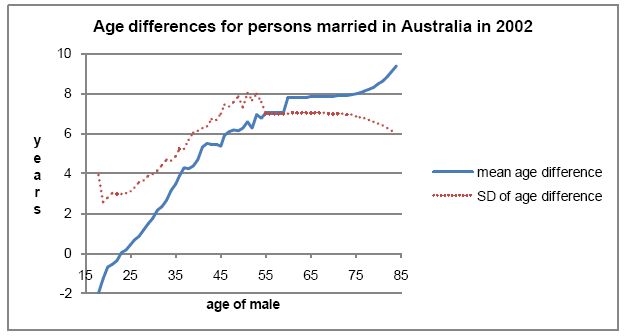
Age differences of persons married in Australia in 2002.
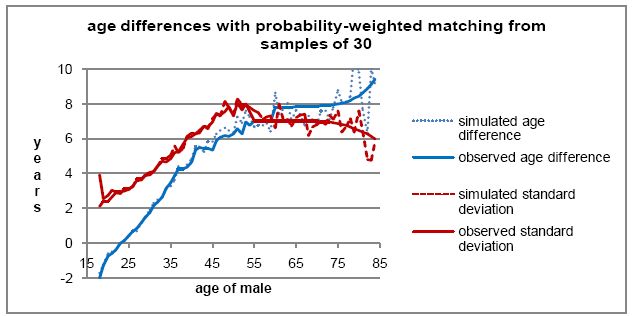
Figure 2

Age differences of persons with probability-weighted matching.
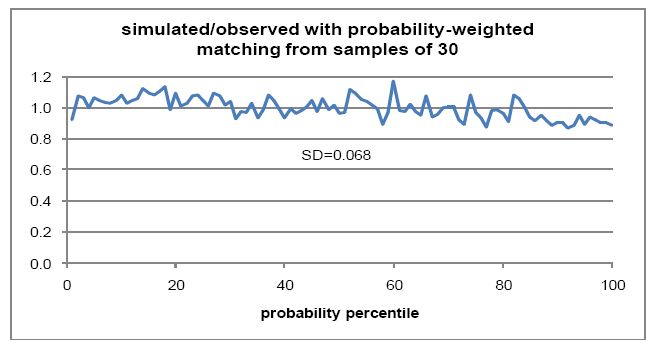
Figure 3

Percentile ratios for probability-weighted matching.
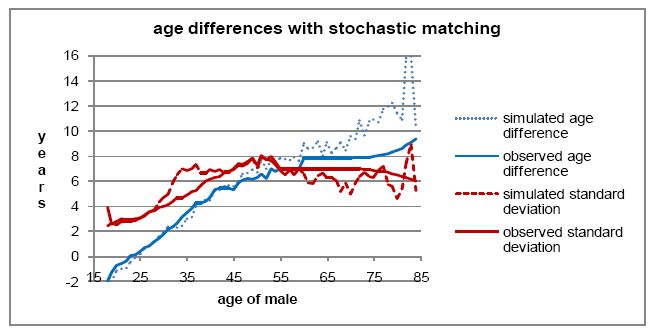
Figure 4

Age differences of persons with stochastic matching.
Figure 5
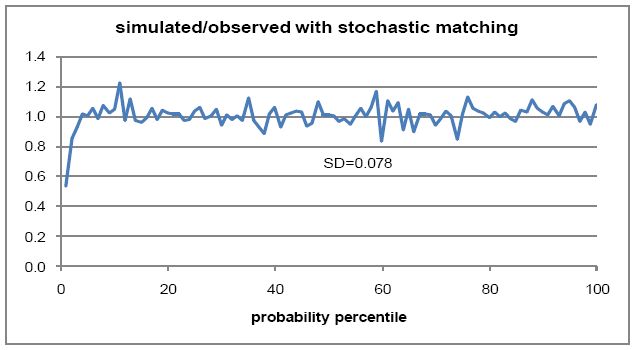

Percentile ratios for stochastic matching.
Tables
Table 1
Mean ages at death.
| Alignment method | Not aligned | Aligned to 63% of mean | Aligned to 100% of mean | Aligned to 127% of mean |
|---|---|---|---|---|
| Sampling by sorting | 77.57 | 86.88 | 76.93 | 69.16 |
| Alignment by sorting | 77.57 | 77.82 | 77.53 | 77.21 |
| Random selection | 77.24 | 77.22 | 77.27 | 77.06 |
Table 2
Numbers of household changes without and with alignment.
| Year | Normal exits (unaligned) | Normal exits (aligned) | Immigrants to align | State exits to align | Type exits to align |
|---|---|---|---|---|---|
| 0 | 0 | 0 | 892 | 1327 | 12,949 |
| 1 | 7588 | 7546 | 346 | 1134 | 9649 |
| 2 | 7766 | 7905 | 530 | 1178 | 9002 |
| 3 | 7792 | 7970 | 484 | 860 | 8945 |
| 4 | 8014 | 8213 | 403 | 1009 | 9137 |
| 5 | 8190 | 8505 | 563 | 1082 | 9764 |
| Average | 7870 | 8028 | 465 | 1053 | 9299 |
Table 3
Average number of exits per area misalignment.
| Year | Number of misalignments | Exits to correct Misalignments | Exits per misalignment |
|---|---|---|---|
| 0 | 2362 | 1327 | 0.56 |
| 1 | 1884 | 1134 | 0.60 |
| 2 | 2046 | 1178 | 0.58 |
| 3 | 1520 | 860 | 0.57 |
| 4 | 1770 | 1009 | 0.57 |
| 5 | 1822 | 1082 | 0.59 |
| Average 1–5 | 1808 | 1053 | 0.58 |
Table 4
Average number of exits per type misalignment.
| Year | Number of misalignments | Exits to correct misalignments | Exits per misalignment |
|---|---|---|---|
| 0 | 11,194 | 12,949 | 1.16 |
| 1 | 5278 | 9649 | 1.83 |
| 2 | 5238 | 9002 | 1.72 |
| 3 | 4950 | 8945 | 1.81 |
| 4 | 5314 | 9137 | 1.72 |
| 5 | 5788 | 9764 | 1.69 |
| Average 1–5 | 5314 | 9299 | 1.75 |
Table 5
Matching methods used in some recent national models.
| Model name | Version | Immediate or batch | Matching method |
|---|---|---|---|
| APPSIM | 2009? | Immediate | Statistical selection from eligible partners |
| CBOLT | 2002? | Batch | Normalised match probabilities |
| DYNACAN | 2002? | Batch | Stochastic |
| DYNASIM3 | 2002? | Batch | Random within race, age & education |
| INAHSIM | 1986 | Batch | Merge by age order |
| MIDAS-BE | 2008 | Batch | Order of decreasing difficulty |
| Pensim2 | 2004 | Batch | Order of decreasing difficulty |
| SESIM | 1997 | Immediate | First male 3 years older in region |
| SMILE | 2005? | Batch | Order of decreasing difficulty |
| SVERIGE | 2002 | Batch | Replication of patterns of recent pairs |
-
Sources
APPSIM – Bacon and Pennec (2007: 19)
CBOLT – Perese (2002: 17)
DYNACAN – Leblanc, Morrison and Redway (2009: 6,11–12)
DYNASIM3 – Favreault and Smith (2004: 9)
INAHSIM – Inagaki (2009)
MIDAS – Dekkers et al. (2009: 33)
Pensim2 – Emmerson, Reed and Shephard (2004: 30)
SESIM – Petterson (2009)
SMILE – O’Donoghue, Lennon and Hynes (2009: 24)
SVERIGE – Holm, Holme, Makilla, Maffsson-Kauppi and Mortvik (2004: 20–23)
Table 6
Performance measures for models fitted to Australian data.
| Probability model | Fitting method | Degrees freedom | Sum of squares | Chi square |
|---|---|---|---|---|
| Quadratic | Least squares | 1,309 | 672,472 | 4,880 |
| Gamma | Least squares | 1,242 | 1,576,369 | 8,323 |
| Quartic | Least squares | 1,175 | 727,746 | 4,397 |
| Piecewise quadratic | Least squares | 1,237 | 122,323 | 1,233 |
| Piecewise quadratic | Logistic | 1,237 | 214,934 | 1,468 |
Table 7
Test results for different matching methods.
| Immediate/ Batch | Matching Method | Sample size | Sum of squares | Chi Square | Percentile SD |
|---|---|---|---|---|---|
| Immediate | Probability weighted | 10 | 1,026,008 | 5,476 | |
| Immediate | Probability weighted | 20 | 497,016 | 3,457 | |
| Immediate | Probability weighted | 30 | 364,242 | 3,049 | 0.068 |
| Immediate | Probability weighted | 50 | 308,535 | 2,816 | |
| Immediate | Probability weighted | 100 | 279,732 | 2,709 | |
| Immediate | Probability weighted | 200 | 259,819 | 2,700 | |
| Immediate | Best of n | 484,912 | 3,879 | 0.090 | |
| Batch | Stochastic | 105,372 | 409,197 | 5,636 | 0.078 |
| Batch | Order of decreasing difficulty | 105,372 | 185,184,957 | 621,141 | 1.485 |
| Batch | ODD/probability weighted | 105,372 | 2,214,049 | 12,395 |
Download links
A two-part list of links to download the article, or parts of the article, in various formats.