The Growth and Poverty Impacts of Trade Liberalization in Senegal
- Université Laval, Pavillon J-A DeSève, Quebec, Canada
- Monash University, Centre of Policy Studies, Australia
Cite this article
as: J. Cockburn, E. Corong, B. Decaluwé, I. Fofana, V. Robichaud; 2010; The Growth and Poverty Impacts of Trade Liberalization in Senegal; International Journal of Microsimulation; 3(1); 109-113.
doi: 10.34196/ijm.00029
- Article
- Figures and data
- Jump to
Figures
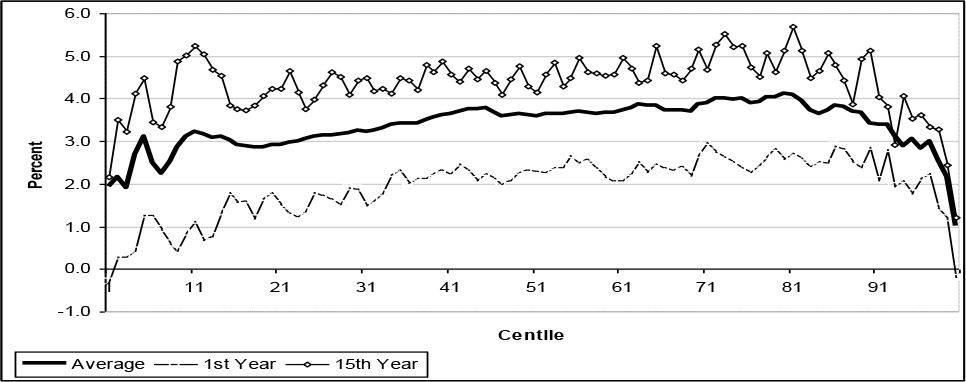
Figure 1

Growth incidence curves for Senegal (consumption).
Source: Cockburn et al. (2010).
Figure 2
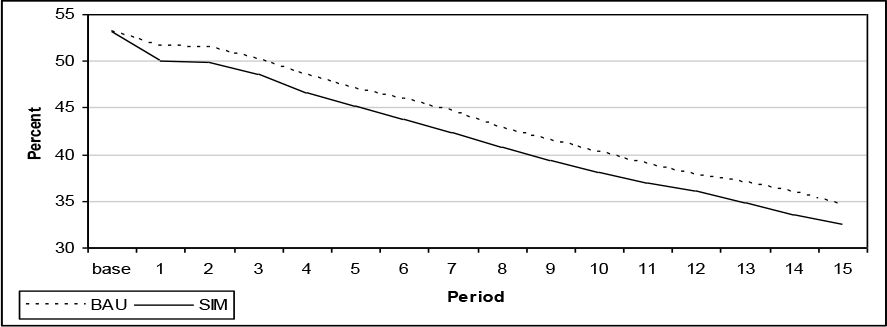
Change in poverty incidence (percent).
Source: Cockburn et al. (2010).
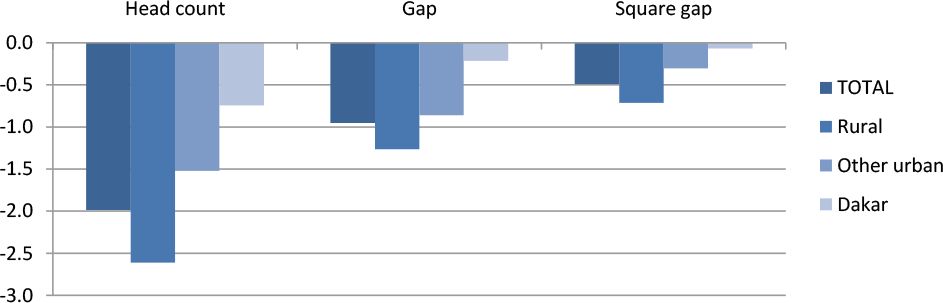
Figure 3

Change in poverty measures (in percentage points).
Source: Cockburn et al. (2010).
Tables
Table 1
Key characteristics of external trade (percent).
| Share | Ratio | Tariff rates | ||||
|---|---|---|---|---|---|---|
| Value added | Imports | Exports | Imports/ Consumption | Exports/ Output | ||
| Primary | 15.7 | 19.3 | 9.3 | 26.2 | 8.5 | 7.1 |
| Industrial | 25.7 | 72.9 | 54.5 | 44.4 | 18.6 | 16.7 |
| Services | 58.6 | 7.8 | 36.2 | 8.4 | 18.1 | 0.0 |
| All | 100.0 | 100.0 | 100.0 | 30.9 | 18.4 | 13.6 |
-
Source: Cockburn et al. (2010).
Table 2
Impacts on demand, output and prices (percent).
| Volumes | Prices | |||||||||
|---|---|---|---|---|---|---|---|---|---|---|
| Imports | Dom. sales | Exports | Output | Value added | Imports | Dom. sales | Exports | Output | Value added | |
| Primary | 8.4 | 2.6 | 18.1 | 4.3 | 3.6 | −4.4 | −3.2 | 0.0 | −4.7 | −5.9 |
| Industrial | 16.3 | 0.5 | 19.8 | 4.2 | 5.5 | −12.9 | −2.3 | 0.0 | −3.6 | −4.3 |
| Services | 0.3 | 2.8 | 15.4 | 4.4 | 3.4 | 1.8 | 1.5 | 0.0 | −0.5 | 0.5 |
| TOTAL | 13.7 | 1.8 | 18.2 | 4.3 | 3.9 | −10.3 | −0.8 | 0.0 | −2.4 | −1.8 |
-
Source: Cockburn et al. (2010).
Table 3
Impacts on income and rates of return to factors (percent).
| Initial share in total income | Change in rates of return to factors | |
|---|---|---|
| Labor income | 40.9 | −0.4 |
| Total male | 28.4 | −0.4 |
| Rural | 12.1 | −2.3 |
| Urban | 16.3 | 1.0 |
| -unskilled | 7.0 | −1.2 |
| -skilled | 9.3 | 3.9 |
| Total female | 12.5 | −0.8 |
| Rural | 4.5 | −2.4 |
| Urban | 8.0 | 0.2 |
| -unskilled | 2.3 | −1.4 |
| -skilled | 5.7 | 4.1 |
| Capital | 29.7 | −3.0 |
| Non-factor income | 29.5 | −4.3 |
| Total household income | 100.0 | −2.0 |
| Consumer price index | −6.7 |
-
Source: Cockburn et al. (2010).
Download links
A two-part list of links to download the article, or parts of the article, in various formats.